from The Full Feed from HuffingtonPost.com by
The economic news this week added further evidence to the story that the economy is bottoming. While we are not out of the woods yet (by a long shot) the worst is behind us.
The U.S. Census Bureau announced today that advance estimates of U.S. retail and food services sales for June, adjusted for seasonal variation and holiday and trading-day differences, but not for price changes, were $342.1 billion, an increase of 0.6 percent (±0.5%) from the previous month, but 9.0 percent (±0.7%) below June 2008. Total sales for the April through June 2009 period were down 9.6 percent (±0.5%) from the same period a year ago. The April to May 2009 percent change was unrevised from 0.5 percent (±0.3%).Retail trade sales were up 0.8 percent (±0.7%) from May 2009, but 10.0 percent (±0.7%) below last year. Gasoline stations sales were down 31.6 percent (±1.5%) from June 2008 and motor vehicle and parts dealers sales were down 14.1 percent (±2.5%) from last year.
Here is the chart:
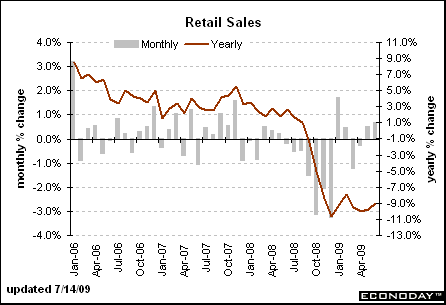
Notice the gray lines on the chart which represent the month to month change. These have been fluctuating around the 0 mark for the last 6 months and have been positive for the last 4 of the 6. This is a marked improvement from the freefall this index was in for the last part of last year. Also note the year over year number has bottomed as well.
From the New York Federal Reserve
The Empire State Manufacturing Survey indicates that conditions for New York manufacturers were flat in July. The general business conditions index increased to a level close to zero, rising 9 points, to -0.6. The new orders index rose above zero for the first time in several months, and the shipments index also climbed into positive territory.
This is a very encouraging report as it indicates the possibility of a positive manufacturing situation is increasing.
The Philadephia Fed Report however, dropped a bit as indicated on this chart from the report:
But also notice the trend here is clearly up. The index bottomed at the end of last year/beginning of this year and has been increasing ever since. In addition, combining these regional charts with the overall ISM manufacturing index
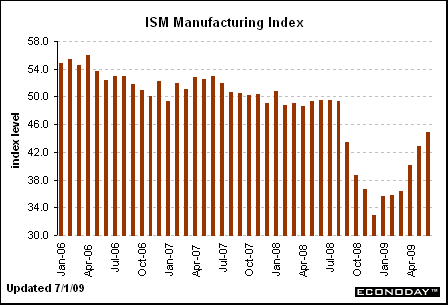
And you get a positive picture.
In addition there is actually good news on the housing front.
Privately-owned housing starts in June were at a seasonally adjusted annual rate of 582,000. This is 3.6 percent (±11.3%)* above the revised May estimate of 562,000, but is 46.0 percent (±4.3%) below the June 2008 rate of 1,078,000.Single-family housing starts in June were at a rate of 470,000; this is 14.4 percent (±11.8%) above the revised May figure of 411,000. The June rate for units in buildings with five units or more was 101,000.
Here is the relevant chart:
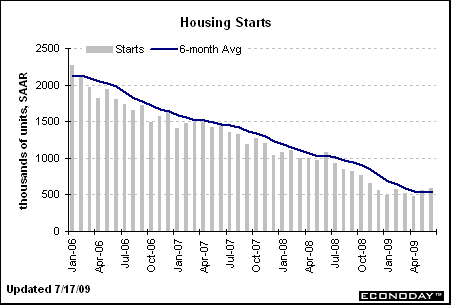
There are several points here. First, housing starts appear to be bottoming -- they've been at roughly the same level for the last 6 months. Assuming this pattern continues that means good things down the road for employment because we've lost a ton of construction jobs. In addition, housing is usually an important component of economic recovery. And while the current inventory overhang prevents a strog increase in housing starts even a weak increase would help with future growth prospects.
Perhaps the best news for the week came from initial unemployment claims:
In the week ending July 11, the advance figure for seasonally adjusted initial claims was 522,000, a decrease of 47,000 from the previous week's revised figure of 569,000. The 4-week moving average was 584,500, a decrease of 22,500 from the previous week's revised average of 607,000.
There have been some statistical issues with the weekly series related to auto industry adjustments. Therefore, it's better to use the 4-week moving average of initial claims which is still moving lower:
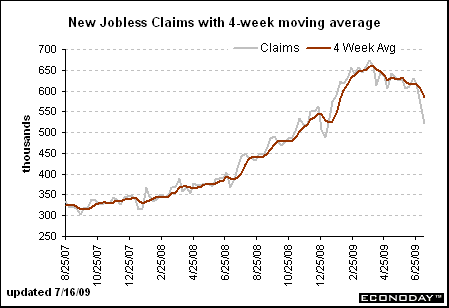
This is a very important statistic because it usually crests right at or near the end of a recession:
The one piece of bad news is industrial production is still contracting:
Industrial production decreased 0.4 percent in June after having fallen 1.2 percent in May. For the second quarter as a whole, output fell at an annual rate of 11.6 percent, a more moderate contraction than in the first quarter, when output fell 19.1 percent. Manufacturing output moved down 0.6 percent in June, with declines at both durable and nondurable goods producers. Outside of manufacturing, the output of mines fell 0.5 percent in June, and the output of utilities increased 0.8 percent. The rate of capacity utilization for total industry declined in June to 68.0 percent, a level 12.9 percentage points below its average for 1972-2008. Prior to the current recession, the low over the history of this series, which begins in 1967, was 70.9 percent in December 1982.
The good news in this series is the month to month decrease is slowing. And the second quarter showed a slowing decline compared to the first quarter. Given the continued good news in other manufacturing numbers (empire state, Philly and ISM as documented above) I expect this number to continue to improve. However, as I noted on my blog:
This is one set of statistics that still gives me the willies. Or -- to put it another way -- if there is anything that could screw up the bottoming process it's this series of numbers. Thankfully there are finally in a "less worse" situation......
Bottom line: if there is one series that really threatens a recovery this is it.
So overall things are improving. However this does not mean we are out of the woods. There is no reason to think the expansion will be strong. As I have stated growth above 2% won't happen for awhile and we can expect unemployment (which lags GDP growth) to be high for the foreseeable future.
However, economic events usually happen in an order. And right now the initial signs of a recovery are mounting.


Nenhum comentário:
Postar um comentário