


Há um dia
 Here's our preferred version the Mega-Bear Quartet. This one shows the current S&P 500 from the top of the Tech Bubble in March 2000. This version is more consistent with our general preference for real (inflation-adjusted) analysis of long-term market behavior. When we adjust for inflation, the all-time high for the S&P 500 was in 2000, not 2007.
For regular visitors to this website, here's the familiar musical analogy that allows you to view the bear market comparisons incrementally. Use the blue links to add the parts.
| See also the original version, which puts the start of the current secular bear in October 2007, the nominal all-time high in the S&P 500. |
Filed under: Motorsports, Coupe, Performance, Chevrolet

Continue reading Momentum Race Group to run Camaros in KONI Challenge
This week we saw more evidence that the worst of the recession is behind us.
ISM Manufacturing
The march to 50 is almost complete. July's ISM manufacturing index jumped a very big 4.1 points to 48.9, pointing to a 50 reading for the August report which would mark no-change from July and the bottom of the manufacturing recession. Strength is all over the place in July: new orders 55.3 vs. July's 49.2, production 57.9 vs. 52.5, backlogs 50.0 vs. 47.5, employment 45.6 vs. 40.7. Inventories also added to the headline index, at 33.5 for a 2.7 point improvement from June. Inventories are very likely to continue to rise in the coming months, indicated not only by the gain in new orders but also by customer inventories which continue to fall, down a point to 42.5 and indicating that firms believe inventories at their customers are too low. Prices paid also rose, up 5 points to 55.0 to hint at the beginning of pricing power.
The main point with this data is the 7 months of increases we've seen:
That shows that the manufacturing sector is clearly moving in the right direction.
ISM Non-manufacturing
In July, the NMI registered 46.4 percent, indicating contraction in the non-manufacturing sector at a faster rate compared to June's reading of 47 percent. A reading above 50 percent indicates the non-manufacturing sector economy is generally expanding; below 50 percent indicates the non-manufacturing sector is generally contracting.
While the index dropped, the drop was small -- .6 on their scale. In addition, as the chart indicates the overall trend is still positive:
Pending Home Sales
Boosted by low interest rates and bargain home prices, pending sales of existing homes rose in June for the fifth straight month, the longest streak of gains since 2003, a real estate trade group reported Tuesday.
The pending home sales index rose 3.6% in June after an upwardly revised gain of 0.8% in May, the National Association of Realtors said. The overall index is 6.7% above June 2008's level......
Pending homes sales in June rose in all regions: up 7.1% in the South, 2.9% in the West, 0.8% in the Midwest and 0.4% in the Northeast.
This number will probably drop over the next few months as the spring is usually when people move. However, five months of increases is a good sign. Recently, I argued that we've seen a bottom in housing sales. This adds further evidence to that theory.
Employment
Nonfarm payroll employment continued to decline in July (-247,000), and the unemployment rate was little changed at 9.4 percent, the U.S. Bureau of Labor Statistics reported today. The average monthly job loss for May through July (-331,000) was about half the average decline for November through April (-645,000). In July, job losses continued in many of the major industry sectors.
In looking at the report, first note the unemployment rate has been steady now for three months:
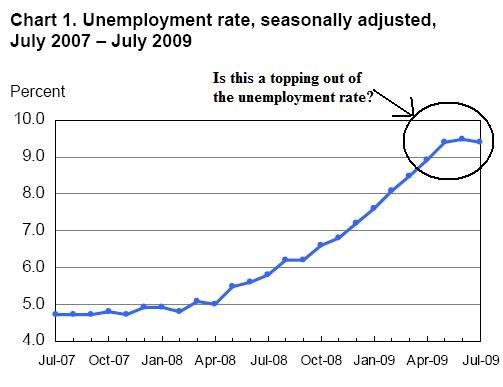
In an of itself, that is an encouraging; it indicates there is a possibility the unemployment rate is topping. Adding further evidence the that theory is the general trend of overall job losses:
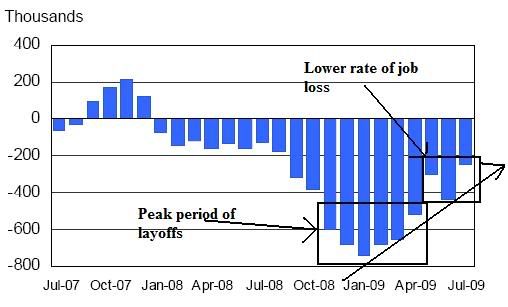
Note there are two areas. The first shows that maximum job losses occurred in the fourth quarter of last year and the first quarter of this year. However the trend since the beginning of this year is for a continuing decline in the number of job losses per month. As the chart above shows that trend has now been in place for six months, indicating we have a firm trend in place.
But there are other reasons indicating things are improving:
The number of persons working part time for economic reasons (sometimes referred to as involuntary part-time workers) was little changed in July at 8.8 million. The number of such workers rose sharply in the fall and winter but has been little changed for 4 consecutive months.
This is good news as it indicates the level of people who are forced to work part time not because they want to but because they have to has been level for the last 4 months.
Let's combine this information with the initial unemployment claims information from yesterday:
Note that the four week moving average of initial claims continues to move lower. Also note that according to theDepartment of Labor the unadjusted (non-seasonally adjusted) numbers fell by 48,000 last week. This is on top of a loss of 90,000 two weeks age and 60,00 next week. In short -- the unadjusted number of initial unemployment claims has dropped by over 200,000 in the last three weeks.
Personal Income
Personal income decreased $159.8 billion, or 1.3 percent, and disposable personal income (DPI) decreased $143.8 billion, or 1.3 percent, in June, according to the Bureau of Economic Analysis. Personal consumption expenditures (PCE) increased $41.4 billion, or 0.4 percent. In May, personal income increased $155.1 billion, or 1.3 percent, DPI increased $168.7 billion, or 1.6percent, and PCE increased $9.0 billion, or 0.1 percent, based on revised estimates.
This release presents revised estimates of personal income and its disposition that reflect the comprehensive revision of the national income and product accounts released on July 31. Tables containing historical data will be posted when they become available on BEA's Web site. For more information on the revision, see the text and box on pages 5 and 6. Real disposable income decreased 1.8 percent in June, in contrast to an increase of 1.5 percent in May. Real PCE decreased 0.1 percent, in contrast to an increase of less than 0.1 percent.
There were increases the last two months followed by a drop this month. However, the increases were caused by transfer payments, not increases in wages. It's important to remember that we're not going to see wage increases for a bit, largely because we're in the middle of high unemployment. During a slack labor market, wages stagnate. However, at least the year over year personal consumption expenditures are still moving sideways:
On balance, that's about the best we can hope for with that statistic for now.
Simply put, the evidence is mounting that the economy is moving in the right direction. We've seen 7 consecutive months of increases in the ISM Manufacturing index. The services index is still in an uptrend. Pending housing sales have increased for the last 5 months and the pace of sales has stabilized at low levels. The employment statistics are moving in the right direction.
Bottom line: the evidence that the worse is behind us continues to mount.
Thoughts from the Frontline Weekly Newsletter Six Impossible Things Before Breakfastby John Mauldin August 7, 2009 |  |
In this issue: | |
The Efficient Market Hypothesis, according to Shiller, is one of the most remarkable errors in the history of economic thought. EMH should be consigned to the dustbin of history. We need to stop teaching it, and brainwashing the innocent. Rob Arnott tells a lovely story of a speech he was giving to some 200 finance professors. He asked how many of them taught EMH - pretty much everyone's hand was up. Then he asked how many of them believed it. Only two hands stayed up! And we wonder why funds and banks, full of the best and brightest, have made such a mess of things. Part of the reason is that we have taught economic nonsense to two generations of students. They have come to rely upon models based on assumptions that are absurd on their face. And then they are shocked when the markets deliver them a "hundred-year flood" every 4 years. The models say this should not happen. But do they abandon their models? No, they use them to convince regulators that things should not be changed all that much. And who can argue with a model that was the basis for a Nobel Prize? I am again out of town this week, but I have been saving a speech done by my friend James Montier of Société Générale in London on the problems with the Efficient Market Hypothesis (EFM). While parts of it are wonkish, there are also parts that are quite funny (at least to an economist). Ideas have consequences, and bad ideas usually have bad consequences. The current maelstrom from which we are emerging (finally, if in fits and starts) has many culprits. A lot of bad ideas and poor management that came together to create the perfect storm. Today, we look at some of the ideas that are part of the problem but are too often glossed over because they are "academic" and not of the real world. However, gentle reader, academic ideas that are taught and accepted as gospel by 99% of the professors have real-world consequences. Where does your money manager stand on these topics? It does make a difference. And now, let's jump into James's speech. Six impossible things before breakfast, or how EMH has damaged our industryWhat follows is the text of a speech to be delivered at the CFA UK conference on "What ever happened to EMH". Dedicated to Peter Bernstein - Peter will be fondly remembered and sadly missed by all who work in investment. Although he and I often ended up on opposite sides of the debates, he was true gentleman and always a pleasure to discuss ideas with. I am sure Peter would have disagreed with some, much and perhaps all of my speech today, but I'm equally sure he would have enjoyed the discussion. The Dead Parrot of FinanceGiven that this is the UK division of the CFA I am sure that The Monty Python Dead Parrot Sketch will be familiar to all of you. The EMH is the financial equivalent of the Dead Parrot. I feel like the John Cleese character (an exceedingly annoyed customer who recently purchased a parrot) returning to the petshop to berate the owner:
The shopkeeper (picture Gene Fama if you will) keeps insisting the parrot is simply resting. Incidentally, the Dead Parrot Sketch takes on even more meaning when you recall Stephen Ross's words that "All it takes to turn a parrot into a learned financial economist is just one word - arbitrage".
The EMH supporters have strong similarities with the Jesuit astronomers of the 17th Century who desperately wanted to maintain the assumption that the Sun revolved around the Earth. The reason for this desire to protect the maintained hypothesis was simple. If the Sun didn't revolve around the Earth, then the Bible's tale of Joshua asking God to make the Sun stand still in the sky was a lie. A bible that lies even once can't be the inerrant foundation for faith! The efficient market hypothesis (EMH) has done massive amounts of damage to our industry. But before I explore some errors embedded within the approach and the havoc that they have wreaked, I would like to say a few words on why the EMH exists at all. Academic theories are notoriously subject to path dependence (or hysteresis, if you prefer). Once a theory has been adopted it takes an enormous amount of effort to dislocate it. As Max Planck said "Science advances one funeral at a time". The EMH has been around in one form or another since the Middle Ages (the earliest debate I can find is between St. Thomas Aquinas and other monks on the 'just' price to charge for corn, with St. Thomas arguing that the 'just' price was the market price). Just imagine we had all grown up in a parallel universe. David Hirschleifer did exactly that: welcome to his world of the Deficient Markets Hypothesis.
In finance we seem to have a chronic love affair with elegant theories. Our faculties for critical thinking seem to have been overcome by the seductive power of mathematical beauty. A long, long time ago, when I was a young and impressionable lad starting out in my study of economics I too was enthralled by the bewitching beauty and power of the EMH/rational expectations approach (akin to the Dark Side in Star Wars). However, in practice we should always remember that there are no points for elegance!
My own disillusionment with EMH and the ultra rational Homo Economius that it rests upon came in my third year of university. I sat on the oversight committee for my degree course as a student representative. Now at the university I attended it was possible to elect to graduate with a specialism in Business Economics, if you took a prescribed set of courses. The courses necessary to attain this degree were spread over two years. It wasn't possible to do all the courses in one year, so students needed to stagger their electives. Yet at the beginning of the third year I was horrified to find students coming to me to complain that they hadn't realised this! These young economists had failed to solve the simplest two-period optimisation problem I can imagine! What hope for the rest of the world. Perhaps I am living evidence that finance is like smoking. Ex-smokers always seem to provide the most ardent opposition to anyone lighting up. Perhaps the same thing is true in finance! The Queen of Hearts and impossible beliefsI'm pretty sure that the Queen of Hearts would have made an excellent EMH economist.
Earlier I alluded to a startling lack of critical thinking in finance. This lack of 'logic' isn't specific to finance, in general we, as a species, suffer belief bias. This a tendency to evaluate the validity of an argument on the basis of whether or not one agrees with the conclusion, rather than on whether or not it follows logically from the premise. Consider these four syllogisms:
These four syllogisms provide us with a mixture of validity and believability. The table below separates out the problems along these two dimensions. This enables us to assess which criteria people use in reaching their decisions.
As the chart reveals, it is the believability not the validity of the concept that seems to drive behaviour. When validity and believability coincide, then 90% of subjects reach the correct conclusion. However, when the puzzle is invalid but believable, some 66% still accepted the conclusion as true. When the puzzle is valid but unbelievable only around 60% of subjects accepted the conclusion as true. Thus we have a tendency to judge things by their believability rather than their validity - clear evidence that logic goes out of the window when beliefs are strong.
All this talk about beliefs makes EMH sound like a religion. Indeed, it has some overlap with religion in that belief appears to be based on faith rather than proof. Debating the subject can also give rise to the equivalent of religious fanaticism. In his book 'The New Finance: The Case Against Efficient Markets', Robert Haugen (long regarded as a heretic by many in finance) recalls a conference he was speaking at where he listed various inefficiencies. Gene Fama was in the audience and at one point yelled "You're a criminal....God knows markets are efficient". Slaves of some defunct economistTo be honest I wouldn't really care if EMH was just some academic artefact. The real damage unleashed by the EMH stems from the fact that as Keynes long ago noted "practical men... are usually the slaves of some defunct economist". So let's turn to the investment legacy that the EMH has burdened us with: first off is the Capital Asset Pricing Model (CAPM). I've criticised the CAPM elsewhere (see Chapter 35 of Behavioural Investing), so I won't dwell on the flaws here, but suffice it to say that my view remains that CAPM is CRAP (Completely Redundant Asset Pricing). The aspects of CAPM that we do need to address here briefly are the ones that hinder the investment process. One of the most pronounced of which is the obsession with performance measurement. The separation of alpha and beta is at best an irrelevance and at worst a serious distraction from the true nature of investment. Sir John Templeton said it best when he observed that "the aim of investment is maximum real returns after tax". Yet instead of focusing on this target, we have spawned one industry that does nothing other than pigeonhole investors into categories. As the late, great Bob Kirby opined "Performance measurement is one of those basically good ideas that somehow got totally out of control. In many cases, the intense application of performance measurement techniques has actually served to impede the purpose it is supposed to serve." The obsession with benchmarking also gives rise to one of the biggest sources of bias in our industry - career risk. For a benchmarked investor, risk is measured as tracking error. This gives rise to Homo Ovinus - a species who are concerned purely with where they stand relative to the rest of the crowd. (For those who aren't up in time to listen to Farming Today, Ovine is the proper name for sheep). This species is the living embodiment of Keynes' edict that "it is better for reputation to fail conventionally than to succeed unconventionally". More on this poor creature a little later.
Whilst on the subject of benchmarking, we can't leave without observing that EMH and CAPM also give rise to market indexing. Only in an efficient market is a market cap-weighted index the 'best' index. If markets aren't efficient then cap weighting leads us to overweight the most expensive stocks and underweight the cheapest stocks! Before we leave risk behind, we should also note the way in which fans of EMH protect themselves against evidence that anomalies such as value and momentum exist. In a wonderfully tautological move, they argue that only risk factors can generate returns in an efficient market, so these factors must clearly be risk factors! Those of us working in the behavioural camp argue that behavioural and institutional biases are the root causes of the outperformance of the various anomalies. I have even written papers showing that value isn't riskier than growth on any definition that the EMH fans might choose to use (see Mind Matters, 21 April 2008 for details). For instance, if we take the simplest definition of risk used by the EMH fans (the standard deviation of returns), then the chart below shows an immediate issue for EMH. The return on value stocks is higher than the return on growth stocks, but the so-called 'risk' of value stocks is lower than the risk of growth stocks - in complete contradiction to the EMH viewpoint.
This overt focus on risk has again given rise to what is in my view yet another largely redundant industry - risk management. The tools and techniques are deeply flawed. The use of measures such as VaR gives rise to the illusion of safety. All too often they use trailing inputs calculated over short periods of time, and forget that their model inputs are effectively endogenous. The 'risk' inputs such as correlation and volatility are a function of a market which functions more like poker than roulette (i.e. the behaviour of the other players matters). Risk shouldn't be defined as standard deviation (or volatility). I have never met a long-only investor who gives a damn about upside volatility. Risk is an altogether more complex topic - I have argued that a trinity of risk sums up the aspects that investors should be looking at. Valuation risk, business or earnings risk, and balance sheet risk. Of course, under CAPM the proper measure of risk is beta. However, as Ben Graham pointed out beta measures price variability, not risk. Beta is probably most often used by analysts in their calculations of the cost of capital, and indeed by CFOs in similar calculations. However, even here beta is unhelpful. Far from the theoretical upward sloping relationship between risk and return, the evidence (including that collected by Fama and French) shows no relationship, and even arguably an inverse one from the model prediction. This, of course, ignores the difficulties and vagaries of actually calculating beta. Do you use, daily, weekly or monthly data, over what time period? The answers to these questions are non-trivial in their impact upon the analysts calculations. In a very recent paper, Fernandez and Bermejo showed that the best approach might simply to assume that beta equals 1.0 for all stocks. (Another reminder that there are no points for elegance in this world!) The EMH has also given us the Modigliani and Miller propositions on dividend irrelevance, and capital structure irrelevance. These concepts have both been used by unscrupulous practitioners to further their own causes. For instance, those in favour of repurchases over dividends, or even those in favour of retained earnings over distributed earnings, have effectively relied upon the M&M propositions to argue that shareholders should be indifferent to the way in which they receive their return (ignoring the inconvenient evidence that firms tend to piss away their retained earnings, and that repurchases are far more transitory in nature than dividends). Similarly, the M&M capital structure irrelevance proposition has encouraged corporate financiers and corporates themselves to gear up on debt. After all, according to this theory investors shouldn't care whether 'investment' is financed by retained earnings, equity issuance or debt issuance. The EMH also gave rise to another fallacious distraction of our world - shareholder value. Ironically this started out as a movement to stop the focus on short-term earnings. Under EMH, the price of a company is, of course, just the net present value of all future cash flows. So focusing on maximizing the share price was exactly the same thing as maximizing future profitability. Unfortunately in a myopic world this all breaks down, and we end up with a quest to maximize short-term earnings! But perhaps the most insidious aspect of the EMH is the way in which it has influenced the behaviour of active managers in their pursuit of adding value. This might sound odd, but bear with me while I try to explain what might upon cursory inspection sound like an oxymoron. All but the most diehard of EMH fans admit that there is a role for active management. After all, who else would keep the market efficient - a point first made by Grossman and Stigliz in their classic paper, 'The impossibility of the informational efficient market'. The extreme diehards probably wouldn't even tolerate this, but their arguments don't withstand thereductio ad absurdum that if the market were efficient, prices would of course be correct, and thus volumes should be equal to zero. The EMH is pretty clear that active managers can add value via one of two routes. First there is inside information - which we will ignore today because it is generally illegal in most markets. Second, they could outperform if they could see the future more accurately than everyone else. The EMH also teaches us that opportunities will be fleeting as someone will surely try to arbitrage them away. This, of course, is akin to the age old joke about the economist and his friend walking along the street. The friend points out a $100 bill lying on the pavement. The economist says, "It isn't really there because if it were someone would have already picked it up". Sadly these simple edicts are no joking matter as they are probably the most damaging aspects of the EMH legacy. Thus the EMH urges investors to try and forecast the future. In my opinion this is one of the biggest wastes of time, yet one that is nearly universal in our industry. Pretty much 80-90% of the investment processes that I come across revolve around forecasting. Yet there isn't a scrap of evidence to suggest that we can actually see the future at all.
The EMH's insistence on the fleeting nature of opportunities combined with the career risk that bedevils Homo Ovinus has led to an overt focus on the short-term. This is typified by the chart below which shows the average holding period for a stock on the New York Stock Exchange. It is now just six months!
The undue focus upon benchmark and relative performance also leads Homo Ovinus to engage in Keynes' beauty contest. As Keynes wrote:
This game can be easily replicated by asking people to pick a number between 0 and 100, and telling them the winner will be the person who picks the number closest to two-thirds the average number picked. The chart below shows the results from the largest incidence of the game that I have played - in fact the third largest game ever played, and the only one played purely among professional investors.
The highest possible correct answer is 67. To go for 67 you have to believe that every other muppet in the known universe has just gone for 100. The fact we got a whole raft of responses above 67 is more than slightly alarming. You can see spikes which represent various levels of thinking. The spike at fifty reflects what we (somewhat rudely) call level zero thinkers. They are the investment equivalent of Homer Simpson, 0, 100, duh 50! Not a vast amount of cognitive effort expended here! There is a spike at 33 - of those who expect everyone else in the world to be Homer. There's a spike at 22, again those who obviously think everyone else is at 33. As you can see there is also a spike at zero. Here we find all the economists, game theorists and mathematicians of the world. They are the only people trained to solve these problems backwards. And indeed the only stable Nash equilibrium is zero (two-thirds of zero is still zero). However, it is only the 'correct' answer when everyone chooses zero. The final noticeable spike is at one. These are economists who have (mistakenly...) been invited to one dinner party (economists only ever get invited to one dinner party). They have gone out into the world and realised the rest of the world doesn't think like them. So they try to estimate the scale of irrationality. However, they end up suffering the curse of knowledge (once you know the true answer, you tend to anchor to it). In this game, which is fairly typical, the average number picked was 26, giving a two-thirds average of 17. Just three people out of more than 1000 picked the number 17. I play this game to try to illustrate just how hard it is to be just one step ahead of everyone else - to get in before everyone else, and get out before everyone else. Yet despite this fact, it seems to be that this is exactly what a large number of investors spend their time doing. Prima facie case against EMH -- Forever blowing bubblesLet me now turn to the prima facie case against the EMH. Oddly enough it is one that doesn't attract much attention in academia. As Larry Summers pointed out in his wonderful parody of financial economics "Traditional finance is more concerned with checking that two 8oz bottles of ketchup is close to the price of one 16oz bottle, than in understanding the price of the 16oz bottle". The first stock exchange was founded in 1602. The first equity bubble occurred just 118 years later - the South Sea bubble. Since then we have encountered bubbles with an alarming regularity. My friends at GMO define a bubble as a (real) price movement that is at least two standard deviations from trend. Now a two standard deviation event should occur roughly every 44 years. Yet since 1925, GMO have found a staggering 30 plus bubbles. That is equivalent to slightly more than one every three years! In my own work I've examined the patterns that bubbles tend to follow. By looking at some of the major bubbles in history (including the South Sea Bubble, the railroad bubble of the 1840s, the Japanese bubble of the late 1980s, and the NASDAQ bubble1), I have been able to extract the following underlying pattern. Bubbles inflate over the course of around three years, with an almost parabolic explosion in prices towards the peak of the bubble. Then without exception they deflate. This bursting is generally slightly more rapidly than the inflation, taking around two years.
Whilst the details and technicalities of each episode are different, the underlying dynamics follow a very similar pattern. As Mark Twain put it "History doesn't repeat but it does rhyme". Indeed, the first well documented analysis of the underlying patterns of bubbles that I can find is a paper by J.S. Mills in 1867. He lays out a framework that is very close to the Minsky/Kindleberger model that I have used for years to understand the inflation and deflation of bubbles. This makes it hard to understand why so many amongst the learned classes seem to believe that you can't identify a bubble before it bursts. To my mind the clear existence and ex ante diagnosis of bubbles represent by far and away the most compelling evidence of the gross inefficiency of markets. The EMH 'Nuclear Bomb'Now as a behaviouralist I am constantly telling people to beware of confirmatory bias - the habit of looking for information that agrees you. So in an effort to avert the accusation that I am guilty of failing to allow for my own biases (something I've done before), I will now turn to the evidence that the EMH fans argue is the strongest defence of their belief - the simple fact that active management doesn't outperform. Mark Rubinstein describes this as the nuclear bomb of the EMH, and says we behaviouralists have nothing in our arsenal to match it, our evidence of inefficiencies and irrationalities amounts to puny rifles. However, I will argue that this viewpoint is flawed both theoretically and empirically. The logical error is a simple one. It is to confuse the absence of evidence with evidence of the absence. That is to say, if the EMH leads active investors to focus on the wrong sources of performance (i.e. forecasting), then it isn't any wonder that active management won't be able to outperform. Empirically, the 'nuclear bomb' is also suspect. Today I want to present two pieces of evidence that highlight the suspect nature of the EMH claim. The first is work by Jonathan Lewellen of Dartmouth College. In a recent paper, Lewellen looked at the aggregate holdings of US institutional investors over the period 1980-2007. He finds that essentially they hold the market portfolio. To some extent this isn't a surprise, as the share of institutional ownership has risen steadily over time from around 30% in 1980 to almost 70% at the end of 2007. This confirms the zero sum game aspect of active management (or negative sum, after costs) and also the validity of Keynes' observation that it [the market] is professional investors trying to outsmart each other.
However, Lewellen also shows that, in aggregate, institutions don't try to outperform! He sorts stocks into quintiles based on a variety of characteristics and then compares the fraction of the institutional portfolio invested in each (relative to institutions' investment in all five quintiles) with the quintile's weight in the market portfolio (the quintile's market cap relative to the market cap of all five quintiles) - i.e. he measures the weight institutional investors place on a characteristic relative to the weight the market places on each trait. The chart below shows the results for a sample of the characteristics that Lewellen used. With the exception of size, the aggregate institutional portfolio barely deviates from the market weights. So institutions aren't even really trying to tilt their portfolios towards the factors we know generate outperformance over the long term.
Lewellen concludes:
Put into our terms, institutions are more worried about career risk (losing your job) or business risk (losing funds under management) than they are about doing the right thing! The second piece of evidence I'd like to bring to your addition is a paper by Randy Cohen, Christopher Polk and Bernhard Silli. They examined the 'best ideas' of US fund managers over the period 1991-2005. 'Best ideas' are measured as the biggest difference between the managers' holdings and the weights in the index. The performance of these best ideas is impressive. Focusing on the top 25% of best ideas across the universe of active managers, Cohen et al find that the average return is over 19% p.a. against a market return of 12% p.a. That is to say, the stocks in which the managers display most confidence did outperform the market by a significant degree. The corollary to this is that the other stocks they hold are dragging down their performance. Hence it appears that the focus on relative performance -and the fear of underperformance against an arbitrary benchmark - is a key source of underperformance. At an anecdotal level I have never quite recovered from discovering that a value manager at a large fund was made to operate with a 'completion portfolio'. This was a euphemism for an add-on to the manager's selected holdings that essentially made his fund behave much more like the index! As Cohen et al conclude "The poor overall performance of mutual fund managers in the past is not due to a lack of stock-picking ability, but rather to institutional factors that encourage them to over-diversify". Thus as Sir John Templeton said, "It is impossible to produce a superior performance unless you do something different from the majority". The bottom line is that the EMH nuclear bomb is more of a party popper than a weapon of mass destruction. The EMH would have driven Sherlock Holmes to despair. As Holmes opined "It is a capital mistake to theorize before one has data. Insensibly one begins to twist facts to suit theories, instead of theories to suit facts". The EMH, as Shiller puts it, is "one of the most remarkable errors in the history of economic thought". EMH should be consigned to the dustbin of history. We need to stop teaching it, and brain washing the innocent. Rob Arnott tells a lovely story of a speech he was giving to some 200 finance professors. He asked how many of them taught EMH - pretty much everyone's hand was up. Then he asked how many of them believed in it....only two hands remained up! A similar sentiment seems to have been expressed by the recent CFA UK survey which revealed that 67% of respondents thought that the market failed to behave rationally. When a journalist asked me what I thought of this, I simply said "About bloody time". However, 76% said that behavioural finance wasn't yet sufficiently robust to replace modern portfolio theory (MPT) as the basis of investment thought. This is, of course, utter nonsense. Successful investors existed long before EMH and MPT. Indeed, the vast majority of successful long-term investors are value investors who reject pretty much all the precepts of EMH and MPT. Will we ever be successful at finally killing off the EMH? I am a pessimist. As Jeremy Grantham said when asked what investors would learn from this crisis: "In the short term, a lot. In the medium term, a little. In the long term, nothing at all. That is the historical precedent". Or as JK Galbraith put it, markets are characterised by "Extreme brevity of financial memory... There can be few fields of human endeavour in which history counts for so little as in the world of finance". Footnote: Maine, Tulsa, and Paul McCartneyI am in Maine today with my youngest son Trey (15), who in all likelihood is once again going to catch more fish than Dad. I guess after going through it with his six siblings, I should be used to it by now; but he’s hitting me with, “Dad, when can I get my learner’s permit? Did you know you have to have a learner’s permit for a whole six month’s before you drive? I don’t want to wait until I’m 16.” This conversation or variants of it keep coming up. I tell him I could predict much better when he would get the permit if I knew how he would do in math this year. You gotta love it. August 22 is fast approaching. Amanda is getting married to a fine young ex-Marine, and of course all the family will be there, along with a large guest list. Seems everyone knows Amanda. It will be a fun two days. But one day before leaving for Tulsa, I get to visit Penny Lane by way of a Paul McCartney concert at the new football edifice that is Cowboys Stadium in Arlington. I looked at the set of songs he is doing, and the majority are old Beatle favorites. For one night, I will be taken back in time to when I was as young as my kids and music was intoxicating and a powerful force in our lives. I trust you are enjoying your summer. They go by so fast! Your realizing that he has an internet addiction problem analyst, Copyright 2009 John Mauldin. All Rights Reserved | |

Ed von Renouard working at Honeysuckle Creek Tracking Station in Australia was the first person to see images from the Apollo 11 moonwalk. Image courtesty of Bruce Ekert.
With the monthly “Jobs Report” coming in better than expected (the unemployment rate actually DECLINED in July, when the consensus was for an increase of anywhere from 0.1% to 0.3%), the market pushed higher from the open into what resembled a Trend Day. However, by mid-day, the S&P 500 challenged overhead resistance and a “Three Push” negative divergence pattern (as well as an Elliott Wave fractal) formed at the highs. Let’s take a quick look.

This time we’re taking a look at the @ES mini-S&P 500 futures contract (for September) so that we can see the upward surge from the better than expected Jobs Report announcement (which I mentioned last night could certainly be a market mover).
After the initial impulse to the upside, the bias should have been to the long-side with the possibility of a Trend Day on the horizon.
We then formed three symmetrical “pushes” into the afternoon highs which formed a “Make or Break” Pattern.
The 3/10 Oscillator showed a crisp and clean three-swing divergence (as each new price high was made, the oscillator formed lower highs, which served as non-confirmations of the afternoon highs). This was a sign of weakness, which should have put us in caution or “wait and see” mode to determine if bulls could keep pushing prices higher… they ultimately could not.
The “Three Push” pattern (as described in the Education Section) is a powerful reversal pattern with very low risk and high reward (opportunity) in the event that the final push does lead to the intraday high - which was the case today. A stop is placed just above the high and if you see bearish candles at the third peak, that’s even more evidence odds favor a reversal.
In this case, we saw a simple 5-min shooting star at the highs.
If you look closely, a bearish Cradle Trade formed into the close of the session (these times are in Central/Chicago Time).
I describe how to identify how the day developed, and note key opportunities/trade set-ups as well as how to manage them in today’s “Idealized Trade” Daily Summary report - please check out the link for subscription and additional information.
I also describe the Elliott Wave pattern I labeled above, as well as the Bearish Rising Wedge that terminated at the final high of the day.
The bullish report was favorable for the bulls, but I certainly expected the welcome news to produce a full Trend Day up all day long, squeezing shorts. As I mentioned last night, the two major resistance levels to watch are the 1,007 and 1,014 area… we closed right in the middle of these areas today.
To keep the bullish party going, bulls need to close firmly above 1,014 (preferably 1,020) and if not, then bears would certainly love to take some revenge against this powerful rally that began in early March!
Corey Rosenbloom, CMT
 Last week we featured some commentaries on trading volume during bear market bottoming processes (1929, 1973, and 2000) to get some perspective on the current price-volume relationship.
Today, let's examine the topic from a technical perspective, courtesy of some analysis provided by Serge Perreault, a Chartered Accountant located near Montreal, Canada. Serge points out that all our charts exhibit some form of Inverse Head And Shoulders(IH&S) formation. As the Investopedia link explains, "Many traders will watch for a large spike in volume to confirm the validity of the breakout."
Here's an annotated chart of the Dow Crash of 1929 and the following rally. The IH&S was a second-take affair. The first breakout above the neckline aborted. About six months later a second breakout succeeded. The heavier volume powered the second rally.
The recovery from the 1973 oil crisis was a simpler IH&S pattern. With the breakout, volume increased and maintained the elevated levels for six months or so.
Like the Crash of 1929, the initial rally off the bottom of the Tech Crash aborted. A more successful rally came six months later. Volume was a factor, although less so than in the two earlier illustrations.
Which brings us to today's market. We've had a breakout above the neckline of an IH&S pattern but with low volume compared to the sharp increase in price. Will this rally abort? The relatively low volume so far doesn't bode well for a continuation. Nor does it mesh with the bullish bias of the popular financial media.
We shall see.
