IN PICTURES: 7 Tools Of The Trade
In looking at the chart for the S&P 500, as represented by the S&P 500 SPDRS (NYSE:SPY) ETF, prior resistance was near $107.35, which was actually tested on Tuesday. This is a key level; a failure to hold this area will signify a failed breakout and continued range-bound consolidation. The level to watch for a larger reversal would be the September low near $102. (For further reading, check out The Anatomy Of Trading Breakouts.)
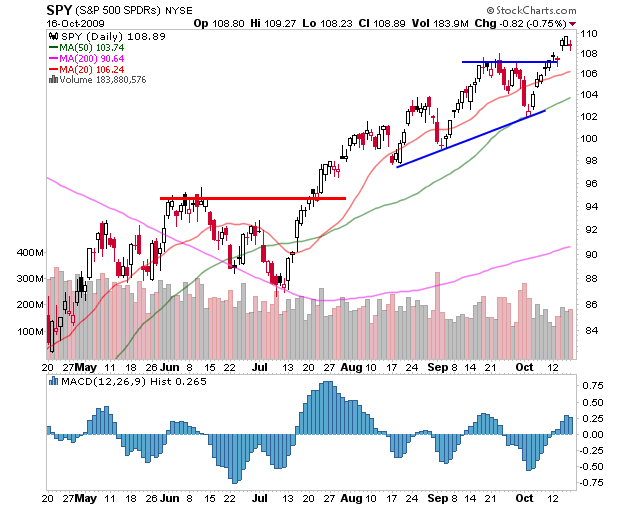 |
| Source: StockCharts.com |
The Diamonds Trust Series 1 (NYSE:DIA) ETF, which tracks the Dow Jones Industrial Average, is also clearly above prior resistance. The resistance area was holding back prior rally attempts near $98, and DIA ended up trading in a base that resembled an ascending triangle. The measured move for this breakout is taken by measuring the move from the lower portion of the pattern to the top and then projecting a move of this magnitude from the breakout area. This would suggest DIA rallying toward the $104 area.
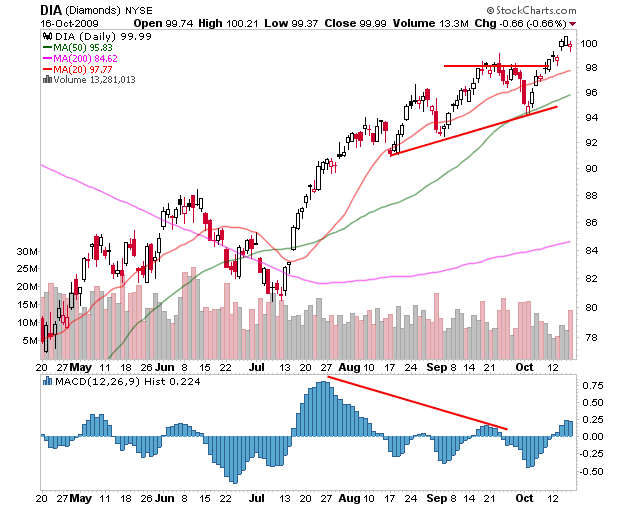 |
| Source: StockCharts.com |
In a very interesting development, the iShares Russell 2000 Index (NYSE:IWM) ETF, which tracks 2,000 companies, is showing a divergence from its larger cap peers. IWM has yet to decisively clear resistance near $62.30. This is interesting because IWM captures a larger sample of stocks and shows weakness in a key group. A breakdown in IWM from this level would be a sign of market weakness and will likely translate to breakout failure from the other groups.
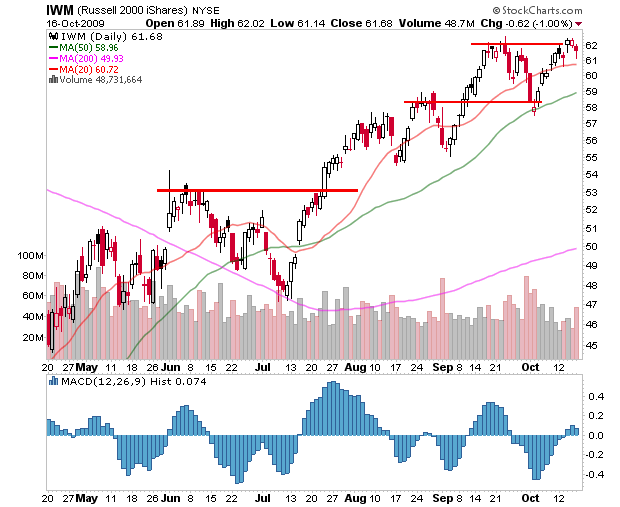 |
| Source: StockCharts.com |
The Powershares QQQ ETF (Nasdaq:QQQQ) lies somewhere between SPY and IWM. On the one hand, QQQQ has been able to clear resistance and has held above this level for a few days. However, it hasn’t been able to distance itself from this area, and the longer it hangs around, the more likely a failure becomes. At this point, it is still a breakout, just not a strong one. With earnings on tap from Apple Inc. (Nasdaq:AAPL) come Monday, it is likely that we will know fairly quickly which way this ETF is headed.
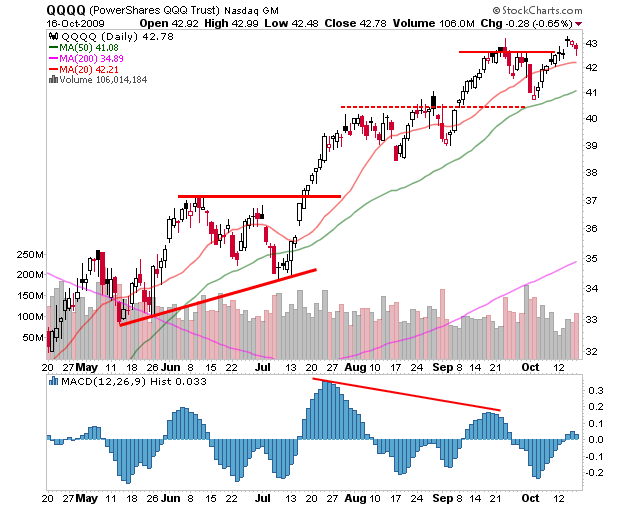 |
| Source: StockCharts.com |
Bottom Line
It’s interesting that the market has left enough doubt in the current breakout to offer key arguments for both sides. Currently, the technical picture is pointing higher, as most of the indexes are trading near new recovery highs. There are clear levels of support underneath most averages and stocks, and these are the levels that should be watched moving forward. With earnings season in full gear, expect the volatility to increase from day to day, so it remains important to focus on these levels rather than getting caught up in the day's emotions.
Use the Investopedia Stock Simulator to trade the stocks mentioned in this stock analysis, risk free!