Summary for Week ending Oct 28th:
Note: The graphs have been changed. If you click on a graph, a larger image will appear with thumbnails of all the graphs in the post below the larger image. This is very fast and does not use scripting like the previous graph gallery. To close the window, just click on the “X” in the upper right. For RSS readers, just the large image will appear. There are
new graph galleries (very fast) that group graphs by topic (I’ll add all the previous galleries soon).
The key story of the week was the European agreement including 1) “develop a voluntary bond exchange with a nominal discount of 50% on notional Greek debt held by private investors”, 2) “to leverage the resources of the EFSF”, and 3) an “agreement … by the members of the European Council on bank recapitalisation and funding”. Here is the
Euro Summit Statement. This is short on details, and without ECB support, mostly just “kicks the can” down the road a few more months.
Another key story was the updated HARP refinance program. Here is the statement from the FHFA:
FHFA, Fannie Mae and Freddie Mac Announce HARP Changes to Reach More Borrowers. I wrote two short posts about this last week:
A few comments on the HARP Refinance Program changes and
More on HARP and Housing. I think this will be helpful and reach more borrowers.
I expect more housing related policy announcements within the next month or two, including the mortgage settlement with lenders are servicers, and a pilot program for Fannie/Freddie/FHA REO disposition.
The U.S. economic data was mixed, but seemed to indicate a little improvement. GDP growth was reported at 2.5% in Q3 (real, annualized). That was an improvement from the first half of the year, but still very sluggish.
New home sales were up slightly to a still very low 313 thousand in September. House prices indexes were mixed with Case-Shiller showing a small seasonal increase in prices – although the prices index will start showing declines soon and will probably fall to new post-bubble lows during the winter months.
Two regional manufacturing surveys were released - the Richmond Fed survey showed further contraction, but the Kansas City survey showed slightly faster expansion.
Next week will be very busy including the employment report and the FOMC meeting. I'll have some preview posts tomorrow (and later in the week for employment).
Here is a summary in graphs:
•
Advance Estimate: Real Annualized GDP Grew at 2.5% in Q3 Click on graph for larger image.
This graph shows the quarterly GDP growth (at an annual rate) for the last 30 years. The dashed line is the current growth rate. Growth in Q2 at 2.5% annualized was below trend growth (around 3%) - and very weak for a recovery, especially with all the slack in the system.
• Real personal consumption expenditures increased 2.4 percent in the second quarter, compared with an increase of 0.7 percent in the second.
• Change in private inventories subtracted 1.08 percentage point.
According to the BEA, real GDP is finally just above the pre-recession peak. The estimate for real GDP in Q3 (2005 dollars) was $13,352.8 billion, 0.2% above the $13,326.0 billion in Q4 2007. Nominal GDP was reported as $15,198.6 billion in Q3 2011.

This graph is constructed as a percent of the previous peak. This shows when GDP has bottomed - and when GDP has returned to the level of the previous peak. If the indicator is at a new peak, the value is 100%.
At the worst point, real GDP was off 5.1% from the 2007 peak. Now real GDP through Q3 2011 and shows real GDP is back to the the pre-recession peak.
Note: There are really two measures of GDP: 1) real GDP, and 2) real Gross Domestic Income (GDI). The BEA will release GDI with the 2nd GDP estimate for Q3. GDI was back to the pre-recession peak in Q2.

This following graph shows the rolling 4 quarter contribution to GDP from residential investment, equipment and software, and nonresidential structures. This is important to follow because residential investment tends to lead the economy, equipment and software is generally coincident, and nonresidential structure investment trails the economy.
For the following graph, red is residential, green is equipment and software, and blue is investment in non-residential structures. The usual pattern - both into and out of recessions is - red, green, blue.Residential Investment (RI) made a positive contribution to GDP in Q3 2011, and the four quarter rolling average finally turned positive in Q3.
Equipment and software investment has made a significant positive contribution to GDP for nine straight quarters (it is coincident). The contribution from nonresidential investment in structures was positive in Q3.
The key leading sector - residential investment - has lagged this recovery because of the huge overhang of existing inventory. Usually RI is a strong contributor to GDP growth and employment in the early stages of a recovery, but not this time - and this is a key reason why the recovery has been sluggish so far.
•
New Home Sales increase in September to 313,000
The Census Bureau
reports New Home Sales in September were at a seasonally adjusted annual rate (SAAR) of 313 thousand. This was up from a revised 296 thousand in August (revised up from 295 thousand).
This graph shows New Home Sales vs. recessions since 1963. The dashed line is the current sales rate.

The second graph shows New Home Months of Supply.
Months of supply decreased to 6.2 in September. The all time record was 12.1 months of supply in January 2009. This is still slightly higher than normal (less than 6 months supply is normal).
On inventory, according to the
Census Bureau:
"A house is considered for sale when a permit to build has been issued in permit-issuing places or work has begun on the footings or foundation in nonpermit areas and a sales contract has not been signed nor a deposit accepted."
Starting in 1973 the Census Bureau broke this down into three categories: Not Started, Under Construction, and Completed.

This graph shows the three categories of inventory starting in 1973.
The inventory of completed homes for sale was at 61,000 units in September. The combined total of completed and under construction is at the lowest level since this series started.
The last graph shows sales NSA (monthly sales, not seasonally adjusted annual rate).

In September 2011 (red column), 25 thousand new homes were sold (NSA). This ties the record low for September set in 2010. The high for September was 99 thousand in 2005.
This was above the consensus forecast of 300 thousand, and was tied the record low for the month of September set last year (NSA). New home sales have averaged only 300 thousand SAAR over the 17 months since the expiration of the tax credit ... mostly moving sideways at a very low level (with a little upward slope recently).
•
Case Shiller: Home Prices increased Seasonally in AugustS&P/Case-Shiller
released the monthly Home Price Indices for August (actually a 3 month average of June, July and August).
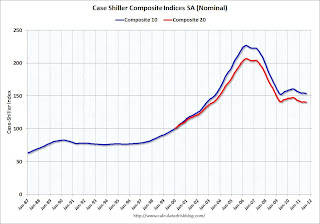
This graph shows the nominal seasonally adjusted Composite 10 and Composite 20 indices (the Composite 20 was started in January 2000).
The Composite 10 index is off 32.2% from the peak, and down 0.2% in August (SA). The Composite 10 is 1.0% above the June 2009 post-bubble bottom (Seasonally adjusted).
The Composite 20 index is off 32.0% from the peak, and down 0.1% in August (SA). The Composite 20 is slightly above the March 2011 post-bubble bottom seasonally adjusted.
The Composite 10 SA is down 3.6% compared to August 2010. The Composite 20 SA is down 3.9% compared to August 2010. This is slightly smaller year-over-year decline than in July.

This graph shows the price declines from the peak for each city included in S&P/Case-Shiller indices. Prices increased (SA) in 6 of the 20 Case-Shiller cities in August seasonally adjusted. Prices in Las Vegas are off 59.8% from the peak, and prices in Dallas only off 9.0% from the peak.
As S&P noted, prices increased in 10 of 20 cities not seasonally adjusted (NSA). However seasonally adjusted, prices only increased in 6 cities.
•
Real House Prices and House Price-to-RentCase-Shiller, CoreLogic and others report nominal house prices. However it is also useful to look at house prices in real terms (adjusted for inflation), as a price-to-rent ratio, and also price-to-income (not shown here).
Below are three graphs showing nominal prices (as reported), real prices and a price-to-rent ratio. Real prices are back to 1999/2000 levels, and the price-to-rent ratio is also back to 2000 levels.
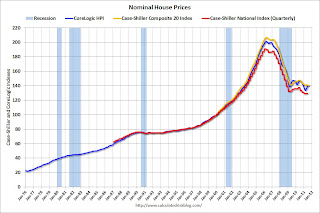
This graph shows the quarterly Case-Shiller National Index SA (through Q2 2011), and the monthly Case-Shiller Composite 20 SA (through August) and CoreLogic House Price Indexes (through August) in nominal terms (as reported).
In nominal terms, the Case-Shiller National index is back to Q4 2002 levels, the Case-Shiller Composite 20 Index (SA) is back to June 2003 levels, and the CoreLogic index is back to July 2003.

The next graph shows the same three indexes in real terms (adjusted for inflation using CPI less Shelter). Note: some people use other inflation measures to adjust for real prices.
In real terms, the National index is back to Q3 1999 levels, the Composite 20 index is back to July 2000, and the CoreLogic index back to June 2000.
In real terms, all appreciation in the last decade is gone.
In October 2004, Fed economist John Krainer and researcher Chishen Wei wrote a Fed letter on price to rent ratios:
House Prices and Fundamental Value. Kainer and Wei presented a price-to-rent ratio using the OFHEO house price index and the Owners' Equivalent Rent (OER) from the BLS.

Here is a similar graph using the Case-Shiller Composite 20 and CoreLogic House Price Index.
This graph shows the price to rent ratio (January 1998 = 1.0).
On a price-to-rent basis, the Composite 20 index is back to August 2000 levels, and the CoreLogic index is back to July 2000.
In real terms - and as a price-to-rent ratio - prices are mostly back to 2000 levels (nationally) and will probably be back to 1999 levels in the next few months.
•
Personal Income increased 0.1% in September, Spending increased 0.6%
This graph shows real Personal Consumption Expenditures (PCE) through August (2005 dollars).
PCE increased 0.6 in August, and real PCE increased 0.5%.
Note: The PCE price index, excluding food and energy, decreased 0.2 percent.
The personal saving rate was at 3.6% in Setpember.

This graph shows the saving rate starting in 1959 (using a three month trailing average for smoothing) through the September Personal Income report.
Spending is growing faster than incomes - and the saving rate has been declining. That can't continue for long ...
•
Consumer Sentiment increased in October, still very weak
The final October Reuters / University of Michigan consumer sentiment index increased to 60.9, up from the preliminary October reading of 57.5, and up from 59.4 in September.
In general consumer sentiment is a coincident indicator and is usually impacted by employment (and the unemployment rate) and gasoline prices. In August, sentiment was probably negatively impacted by the debt ceiling debate.
This was still very weak, but above the consensus forecast of 58.0.
•
NMHC Apartment Survey: Market Conditions Tighten Slightly in Recent SurveyFrom the National Multi Housing Council (NMHC):
Development Ramps Up as Demand Swells Finds NMHC Quarterly Survey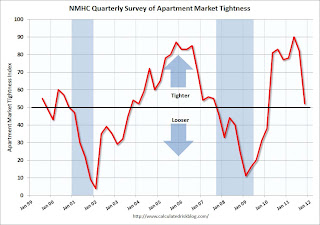
This graph shows the quarterly Apartment Tightness Index.
The index has indicated tighter market conditions for the last seven quarters and although down from the record 90 earlier this year, this still suggests falling vacancy rates and or rising rents.
This fits with the recent
Reis data showing apartment vacancy rates fell in Q3 2011 to 5.6%, down from 6.0% in Q2 2011, and 9.0% at the end of 2009. Based on this index, I expect the declines in vacancy rates to slow.
New multi-family construction is one of the few bright spots for the U.S. economy and this survey indicates demand for apartments is still strong.
•
ATA Trucking Index increased 1.6% in September
From ATA:
ATA Truck Tonnage Index Increased 1.6% in SeptemberHere is a long term graph that shows ATA's For-Hire Truck Tonnage index.
The dashed line is the current level of the index.
Sluggish growth after stalling earlier this year ...
•
Other Economic Stories ... • Chicago Fed:
Economic activity improved in September • From NY Fed President William Dudley:
The National and Regional Economic Outlook•
DOT: Vehicle Miles Driven decreased 1.7% in August compared to August 2010•
A few comments on the HARP Refinance Program changes•
Moody's: Commercial Real Estate Prices increased 2.4% in August • Richmond Fed:
Manufacturing Contraction Persists in October; Employment Turns Negative• From the Kansas City Fed:
Growth in Manufacturing Activity Edged Higher