|
Volume 5 - Issue 37
July 13, 2009
Debt and Deflation
By Van Hoisington and Dr. Lacy Hunt
| There is a reason I call this column Outside the Box. I try to get material that forces us to think outside our normal comfort zones and challenges our common assumptions. I have made the comment more than once that is it unusual for two major bubbles to burst and for the conversation to be all about rising inflation and not a serious problem with deflation.
As Niels Jensen pointed out last week, the most important question that an investor can ask is whether we are in for deflation or inflation. And this week we read a well reasoned piece on deflation. This is one of the more important essays I have sent out. You need to set aside some time to absorb this one.
Van Hoisington and Dr. Lacy Hunt give us a few thoughts on why they think it is deflation that will ultimately be the problem and not inflation we are dealing with today. This week's letter requires you to think, but it will be worth the effort.
And let me quote a few sentences in the middle of this letter about taxes which you need to think about.
"Thus Barro and Perotti are saying that each $1 increase in government spending reduces private spending by about $1, with no net benefit to GDP. All that is left is a higher level of government debt creating slower economic growth."
"The most extensive research on tax multipliers is found in a paper written at the University of California Berkeley entitled The Macroeconomic Effects of Tax Changes: Estimates Based on a new Measure of Fiscal Shocks, by Christina D. and David H. Romer (March 2007). (Christina Romer now chairs the president's Council of Economic Advisors). This study found that the tax multiplier is 3, meaning that each dollar rise in taxes will reduce private spending by $3."
Now, if you put all of the various inputs together, Hoisington and Hunt show that theory suggests we will soon be dealing with deflation. It's counter-intuitive to what we hear today, which is why the Bank for International Settlements used the stagflation word in a recent report. The transition that is coming will not be comfortable....
John Mauldin, Editor
Outside the Box
Debt and Deflation
Quarterly Review and Outlook
Second Quarter 2009
DEBT ACTS AS A BRAKE ON THE MONETARY ENGINE
One of the more common beliefs about the operation of the U.S. economy is that a massive increase in the Fed's balance sheet will automatically lead to a quick and substantial rise in inflation. An inflationary surge of this type must work either through the banking system or through non-bank institutions that act like banks which are often called "shadow banks". The process toward inflation in both cases is a necessary increasing cycle of borrowing and lending. As of today, that private market mechanism has been acting as a brake on the normal functioning of the monetary engine.
For example, total commercial bank loans have declined over the past 1, 3, 6, and 9 month intervals. Also, recent readings on bank credit plus commercial paper have registered record rates of decline (Chart 1). The FDIC has closed a record 52 banks thus far this year, and numerous other banks are on life support. The "shadow banks" are in even worse shape. Over 300 mortgage entities have failed, and Fannie Mae and Freddie Mac are in federal receivership. Foreclosures and delinquencies on mortgages are continuing to rise, indicating that the banks and their non-bank competitors face additional pressures to re- trench, not expand. Thus far in this unusual business cycle, excessive debt and falling asset prices have conspired to render the best efforts of the Fed impotent. The 100% plus expansion in the Fed's balance sheet (monetary base) has done nothing to rekindle borrowing and lending or revive even the smallest spark of inflation. What is clear is that as long as private market factors in the monetary/credit 1creation process are shrinking, as they are now, the risk for the economy is deflation, not inflation.

THE COMPLEX MONETARY CHAIN
The link between Fed actions and the economy is far more indirect and complex than the simple conclusion that Federal asset growth equals inflation. The price level and, in fact, real GDP are determined by the intersection of the aggregate demand (AD) and aggregate supply (AS) curves. Or, in economic parlance, for an increase in the Fed's balance sheet to boost the price level, the following conditions must be met:
- The money multiplier must be flat or rising;
- The velocity of money must be flat or rising; and
- The AS or supply curve must be upward sloping.
The economy and price changes are moving downward because none of these conditions are currently being met; nor, in our judgment, are they likely to be met in the foreseeable future.
Aggregate demand (AD) is planned expenditures for GDP. As defined by the equation of exchange, GDP equals M2 multiplied by the velocity of money (V). M2 equals the monetary base (MB) multiplied by the money multiplier (m). Professors Brunner and Meltzer proved that m is determined by the currency, time, and Treasury deposit ratios, as well as the excess reserve ratio. The money multiplier moves inversely with the currency, Treasury deposit ratios, and excess reserve ratios and positively with the time deposit ratio. For example, if those ratios rise on balance, then m will decline. By algebraic substitution AD(GDP) = MB*V*m. In our present case, the massive increase in the Fed's balance sheet has created a sharp surge in excess reserves, and thus m has fallen.
Obviously the preceding paragraph is as clear as mud. It is included to provide mathematical proof of the complex connection between monetary actions and real world results. The practical and straightforward fact is that GDP has declined in the face of a surge in M2 growth. The labor market equivalent of GDP (aggregate hours worked) has declined at a record rate over the last 18 months, the entire span of the recession (Chart 2). That is, the monetary surge was totally offset by other factors; thus, the recession deepened and inflation was nonexistent.

The conventional wisdom is that the massive increase in excess reserves might eventually be used to make loans and reverse the economic contraction now underway, or that the velocity of money might increase. First, there is a very good explanation for the surge in excess reserves. The Fed now pays interest on its deposits, so banks have been incentivized to shift transaction deposits from riskier alternatives to the safety and liquidity offered by the Fed. Historically transaction deposits at the banks have fluctuated around 3% to 7% of a bank's balance sheet. In the second quarter, excess reserves averaged $800 billion which is 4.4% of the $18 trillion of bank debt (including off balance sheet). If this is the amount needed for transaction purposes, then this "high powered" money is not available for making loans and investments.
Second, velocity (V), or the turnover of money in the economy, is far more likely to fall than to rise. This is because V tends to fall when financial innovation reverses downward. As this process continues excess leverage will eventually diminish and together they will lead V lower. This process has already begun in the household sector.
In addition, the Fed needs an upward sloping supply curve to get the economic ball rolling. Today we estimate that the AS curve is flat. The reason it is in this perfectly elastic shape, rather than upward sloping, is that we have substantial excess labor and other productive resources. For example, in June the work week was at a record low while the U6 unemployment rate was at an all time high of 16.5%. No wonder wages are deflating. Further, industry capacity utilization was at a four decade low at 68.3%, while manufacturing capacity was at a six decade low for the longer running series at 65.0%. Indeed, when excess resources are extreme, the AS curve is likely to be not only horizontal, but shifting outward, meaning that prices will be lower at any level of aggregate demand or GDP. Thus, even if Fed actions could shift the aggregate demand curve outward, which it cannot do under present circumstances, inflation would still be a long way down the road. Thus, theory and current evidence clearly point to deflation as the overwhelming economic risk.
A FISCAL POLICY DRAG
Over the next four years, the ratio of U.S. government debt will rise to somewhere between 71% and 80% of GDP, up from 41% at the end of 2008. The 71% figure, which is from the CBO, is probably understated. The CBO figures do not include the debt of Fannie Mae and Freddie Mac (now owned by the U.S. government), and their economic forecasts are probably too optimistic. None of these projections have incorporated the proposed health care bill which would raise the debt ratio considerably. This substantial increase in government spending far exceeds projected rising revenue sources such as the large marginal tax increase that has been suggested by the reversal in 2010 of the 2001 and 2003 tax reductions.
While the federal deficit is expanding, state and local government spending is being reduced and taxes have increased. It is highly unusual that state and local expenditures have actually decreased in current dollars in the past two quarters and, in real terms, spending is lower than a year ago. This is because state and local governments generally do not have the flexibility to incur deficits, yet they face potential deficits of about $121 billion for fiscal 2010. The Center for Budget and Policy Priorities indicates that thus far this year 23 states have imposed tax increases, with another 13 considering them. This is in addition to the ten states that imposed higher taxes or other revenue boosters in late 2007 or 2008. Therefore, the apparent thrust of federal policy is stimulus, while state and local policy is contractionary.
Interestingly, the term "federal stimulus spending" is an oxymoron. Many assume that the act of sending checks from the federal government sector to the private sector helps the economy through so-called spending multipliers. Multipliers take into consideration the second, third, fourth, etc. round effects from an initial change. Thus, multipliers capture the unintended consequences of policy actions. Although the initial spending objectives may be well intended, the ultimate outcome becomes convoluted. Over the past several years, multipliers have been intensively examined by leading economic scholars. Robert Barro of Harvard University calculates in Macroeconomics a Modern Approach (Thomson/Southwestern, 2008, p. 307) that the government expenditure multiplier from 1955 to 2006 was negative .01, not statistically different from 0. The highly respected Italian econometrician Roberto Perotti of Universita' Bocconi and the Centre for Capital Economic Policy Research has also done extensive work on this subject while visiting the fiscal policy division of the ECB. In October 2004, in his Estimating the Effects of Fiscal Policy in OECD Countries, Perotti calculates that the U.S. expenditure multiplier is also close to 0. Thus Barro and Perotti are saying that each $1 increase in government spending reduces private spending by about $1, with no net benefit to GDP. All that is left is a higher level of government debt creating slower economic growth. There may be intermittent periods when government spending will lift the economy, but offsetting episodes will follow. The best available empirical research suggests that the current federal policy of expanding spending will retard, not improve, the performance of business conditions. In addition to spending multipliers, however, there are also tax multipliers.
The most extensive research on tax multipliers is found in a paper written at the University of California Berkeley entitled The Macroeconomic Effects of Tax Changes: Estimates Based on a new Measure of Fiscal Shocks, by Christina D. and David H. Romer (March 2007). (Christina Romer now chairs the president's Council of Economic Advisors). This study found that the tax multiplier is 3, meaning that each dollar rise in taxes will reduce private spending by $3.
Presently, the federal government is increasing spending that in the end may actually retard economic activity, and is also proposing tax increases that will further restrain private sector growth. This policy mix is the same approach that failed in the U.S. from 1929 to 1941 and also failed in Japan over the past two decades, a subject we addressed in our April letter. In other words, fiscal policy is executing a program that is 180 degrees opposite from what it should be to stimulate the economy. How is it possible to get an inflationary cocktail out of deflationary ingredients?
BUSINESS CYCLE IMPLICATIONS FOR EQUITIES
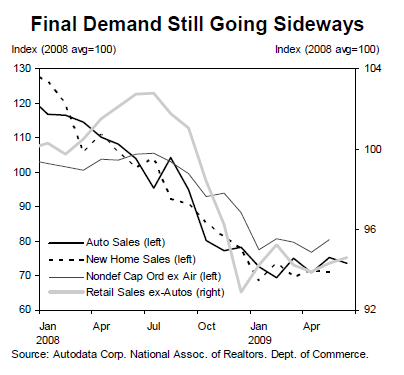
The preferred way to answer the business cycle question of expansion versus contraction is to examine the four variables most integral to the economy's performance: employment, production, personal income, and sales. For these variables to be consistent over time, the income and sales must be adjusted for inflation and personal income must exclude government transfer payments.
Recessions end when the National Bureau of Economic Research (NBER), the official arbiter of such matters, says they end. But sometimes economic conditions suggest that the NBER miscalculated. Economic recovery occurs when these four indicators turn higher at about the same time. If the NBER's cycle turning dates are aligned with these four indicators they have validity. Regardless of the NBER's opinion, if the four indicators are not rising, a normal recovery will not occur. This seemingly esoteric point has important implications for the stock market.
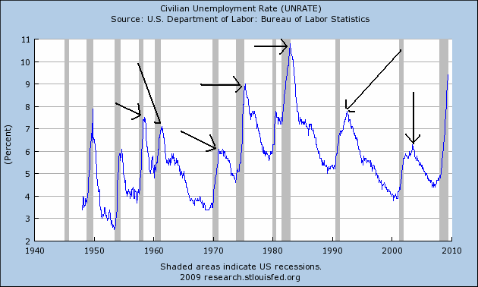
In all the recessions from 1967 to 1999, the NBER aligns its recession ending dates very well with the unified recovery in income, production, employment and sales (Charts 3 & 4). However, for the 2000-2001 recession the NBER call date for the recovery did not line up with these four coincident indicators. Although the recession officially ended in November 2001, employment and income had not turned higher. In fact, they did not trough until March and August 2003 recording lags of 16 and 21 months, respectively. Thus, the economy was only in a partial recovery, a situation that had huge stock market implications.


The S&P 500 Stock Price Index troughed prior to the end of all the NBER defined recessions from 1967 through 1999, in concert with the four key economic variables (Chart 3 & 4). However, in 2001 the S&P bottomed 15 months after the end of the NBER defined recession yet one and six months before the cyclical troughs in income and employment, respectively. In other words, stock prices anticipated the complete, not partial, recovery of these pillars of economic growth. Although all four of these indicators are still falling, the critical event for the financial markets will be when all four finally turn higher. If a complete recovery of these four variables is still far in the future, then the current gains in the stock market cannot be sustained, just as rallies were not sustained in 2001.
DEBT DEFLATION AND BONDS
Total U.S. debt as a percent of GDP surged to 375% in the first quarter, a new post 1870 record, and well above the 360% average for 2008. Therefore, the economy became more leveraged even as the recession progressed. An over- leveraged economy is one prone to deflation and stagnant growth. This is evident in the path the Japanese took after their stock and real estate bubbles began to implode in 1989. At that time Japanese debt as a percent of GDP was 269% (Chart 5). This percentage actually continued to move higher until 1998 when it peaked at 345%, below the current level in the U.S. While the Japanese increased leverage for nine years after the bubble highs, neither highly inflated stock and real estate prices nor economic performance could be sustained as debt repayment became more burdensome.

Contrary to many evaluations of Japan's problems, traditional monetary policy was actually working. This is evidenced by the enlarged Japanese debt ratio in the early years after 1989 which was not merely due to increased government debt. Private debt as a percent of GDP also rose from 219% in 1989 to its peak of 274% in 1996. However, private debt as a percent of GDP turned down in 1997 as government debt absorbed a rising proportion of Japan's credit resources. The greater private debt load, from 1989 to 1996, as well as the massive increase in the government debt from 1989 to the present, coincided with two lost decades, not with prosperity. This template of increasing debt, combined with decreasing asset values, is a warning to investors of the efficacy of our current fiscal and monetary postures.
The combination of an extremely overleveraged economy, ineffectual monetary policy and misdirected fiscal policy initiatives suggests that the U.S. economy faces a long difficult struggle. While depleted inventories and the buildup of pent-up demand may produce intermittent spurts of growth, these brief episodes are not likely to be sustained. In several years, real GDP may be no higher than its current levels. However, since the population will continue to grow, per capita GDP will decline; thus, the standard of living will diminish as unemployment rises. These conditions will produce a deflationary environment similar to the Japanese condition.
Investments in long term Treasury securities are motivated by inflationary expectations. If fixed income investors believe inflation is headed lower, they will invest in long-dated securities, while they will invest in Treasury bills, or inflation protected securities if they believe inflation is headed higher. In the normal recessions since 1950, the low in inflation was, on average, 29 months after a complete economic recovery was underway, and bond yields moved in a similar fashion. If this recession were normal, then the low in inflation would be in late 2011, at which time investors would begin to consider shortening the maturity of their Treasury portfolios. However, because of our highly-indebted circumstances and the movement of private sector resources to the public sector, the trough in inflation will be moved out, meaning that the low in Treasury bond yields is a distant event. The path there will be bumpy, as it was in the U.S. from 1929 to 1941 and in Japan from 1989 to 2008. Presently the 10-year yield in Japan stands at 1.3%. Ultimately, our yield level may be similar to that of the Japanese.
Van R. Hoisington
Lacy H. Hunt, Ph.D.

John F. Mauldin
johnmauldin@investorsinsight.com