Shipping Group Staying Afloat |
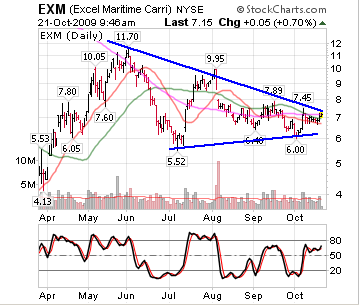
| Commentary: The 200-day moving average is commonly used as the defining line between a bull stock and a bear stock. One of the reasons behind this is that the 200-day moving average encompasses a full year's worth of trading. One common rule of thumb used by traders is to trade stocks above their 200-day moving averages to the long side, and to sell or avoid stocks on the other side of the average. Typically, the 200-day moving average will act as support once a stock is able to trade above it long enough to cause it to slope upward. IN PICTURES: Eight Ways To Survive A Market Downturn In reviewing some sectors, I noticed that shippers are on the verge of making a decisive move above their 200-day moving averages. Many of these stocks have been vacillating above and below this average, as they continue to consolidate in a sideways pattern. Shipping stocks were looking strong in a weak market yesterday, and are toward the upper ranges of some resistance levels they have established over the past few months. If they can clear those levels, it could lead to an important bottom, and ultimately higher prices. (For more, check out Support And Resistance Reversals.) Excel Maritime Carriers (NYSE:EXM) for instance, is trading in a large symmetrical triangle, with the EXM hugging a cluster of the 20, 50, and 200-day moving averages. If EXM can clear this base, it should signal a test of the June high. One key level to watch is the bottom of the base near $6 and $5.50. Failure below these levels would be ominous for this stock. (For related reading, check out Trading Failed Breaks.)
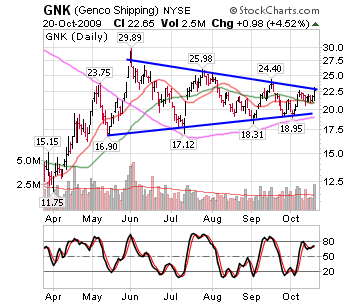
Genco Shipping (NYSE:GNK) is another shipper trading in a symmetrical triangle. There is a clear trendline connecting the recent peaks, and it appears that GNK is testing this resistance area. The measured target for this breakout would place GNK near $32 a share, so this is definitely worth keeping an eye on. The level to watch on the downside is right around the rising 200-day moving average. This level has been acting as support, so a failure here would be a bearish development.
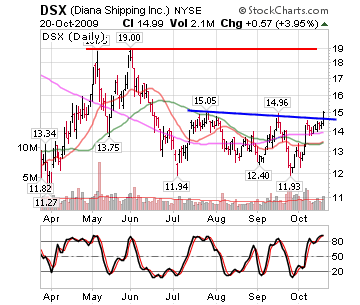
Diana Shipping (NYSE:DSX) is showing a different type of consolidation, but the general thesis remains the same. It has been consolidating above its 200-day moving average, and is close to testing a resistance level above the base it has been building. There is still overhead resistance near $19, but a break above $15 could lead to a test of this level fairly quickly. This in itself would represent a move of more than 20%.
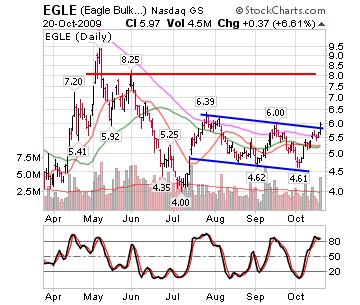
Eagle Bulk Shipping (Nasdaq:EGLE) is a shipper with a chart that closely resembles that of DSX. DSX has been trading in a descending channel over the past few months, after a sharp move higher and an equally sharp move lower in April though July. This consolidation appears constructive, and a move above the descending trendline marking the recent peaks could lead to a test of the April highs. Currently, GNK is already starting to clear this level, and could be in the process of a breakout.
Many of these shippers had a violent move off the lows they hit in March. Of all the sectors, this may have been the hardest hit at a time when investors were fearing the second coming of the Great Depression. Without debating what stage of an economic recovery we are in, the chart patterns are holding much promise for this group. This group is also capable of violent moves in both directions, so while it is definitely a group worth watching for the upside potential, traders must also adhere to strict money management rules. With a little followthrough, this group may make an assault on its April highs. Use the Investopedia Stock Simulator to trade the stocks mentioned in this stock analysis, risk free! |


Nenhum comentário:
Postar um comentário