The Greek political situation is unsettled, and the Europeans have said they support Greece through the next election on June 17th. After that … who knows? There is a strong possibility that Greece will leave the euro not long after the next election.
This was a light week for US economic data. The trade deficit was a little higher than expected, but most of the data improved slightly. The 4-week average of initial weekly unemployment claims declined, small business confidence improved, and consumer sentiment improved, and there were more job openings in March.
In an under reported story, both Fannie and Freddie reported improved performance due to “stabilization of house prices” in certain areas. The sharp decline in "for sale" inventory appears to be supporting house prices, and inventory and house prices continue to be key stories for 2012.
Here is a summary in graphs:
• Trade Deficit increased in March to $51.8 Billion
 The trade deficit was above the consensus forecast of $49.5 billion.
The first graph shows the monthly U.S. exports and imports in dollars through March 2012.
Exports increased in March, and are at record levels. Imports increased even more. Exports are 13% above the pre-recession peak and up 7% compared to March 2011; imports are 3% above the pre-recession peak, and up about 8% compared to March 2011.
 The second graph shows the U.S. trade deficit, with and without petroleum, through March.
The blue line is the total deficit, and the black line is the petroleum deficit, and the red line is the trade deficit ex-petroleum products.
Oil averaged $107.95 per barrel in March, up from $103.63 in February. Import oil prices were probably a little higher in April too, but will probably decline in May. The increase in imports was a combination of more petroleum imports and more imports from China.
• BLS: Job Openings increased in March
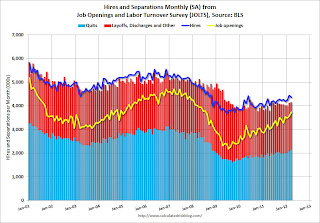
 This graph shows job openings (yellow line), hires (dark blue), Layoff, Discharges and other (red column), and Quits (light blue column) from the JOLTS.
 Jobs openings increased in March to 3.737 million, up from 3.565 million in February. The number of job openings (yellow) has generally been trending up, and openings are up about 17% year-over-year compared to March 2011. This is the highest level for job openings since July 2008.
Quits increased in March, and quits are now up about 8.5% year-over-year and quits are now at the highest level since 2008. These are voluntary separations and more quits might indicate some improvement in the labor market. (see light blue columns at bottom of graph for trend for "quits").
• REO Inventory for Fannie, Freddie and the FHA
 This graph shows the combined REO inventory for Fannie, Freddie and the FHA (FHA through Feb 2012).
The combined REO inventory is down to 203 thousand in Q1 2012, down about 18% from Q1 2011.
The pace of REO acquisitions will probably increase following the mortgage servicer settlement (signed off on April 5th); and dispositions will probably increase too.
• CoreLogic: House Price Index increases in March, Down 0.6% Year-over-year
 From CoreLogic: CoreLogic® March Home Price Index Shows Slight Year-Over-Year Decrease of Less Than One Percent
[CoreLogic March Home Price Index (HPI®) report] shows that nationally home prices, including distressed sales, declined on a year-over-year basis by 0.6 percent in March 2012 compared to March 2011. On a month-over-month basis, home prices, including distressed sales, increased by 0.6 percent in March 2012 compared to February 2012, the first month-over-month increase since July 2011.This graph shows the national CoreLogic HPI data since 1976. January 2000 = 100.
The index was up 0.6% in March, and is down 0.6% over the last year.
The index is off 34% from the peak - and is just above the post-bubble low set last month.
• Weekly Initial Unemployment Claims at 367,000
 Here is a long term graph of weekly claims:
The dashed line on the graph is the current 4-week average. The four-week average of weekly unemployment claims decreased to 379,000.
This decline in the 4-week moving average followed for four consecutive increases.
This was close to the consensus of 366,000. This is two consecutive weeks with initial unemployment claims in the 360s, after averaging close to 390,000 over the previous 3 weeks.
• NFIB: Small Business Optimism Index increases in April
 This graph shows the small business optimism index since 1986. The index increased to 94.5 in April from 92.5 in March. This ties February 2011 as the highest level since December 2007.
Another positive sign is that the "single most important problem" was not "poor sales" in April - for the first time in years. In the best of times, small business owners complain about taxes and regulations, and that is starting to happen again.
This index remains low, but as housing continues to recover, I expect this index to increase (there is a high concentration of real estate related companies in this index).
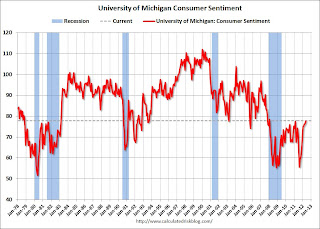
• Consumer Sentiment increases in May to 77.8
 The preliminary Reuters / University of Michigan consumer sentiment index for May increased to 77.8, up from the April reading of 76.4.
This was above the consensus forecast of 76.2 and the highest level since January 2008. Overall sentiment is still fairly weak - probably due to a combination of the high unemployment rate, high gasoline prices and the sluggish economy.
• Other Economic Stories ...
• LPS: House Price Index increased 0.2% in February
• Lawler: Table of Short Sales and Foreclosures for Selected Cities
• Sacramento: Percentage of Distressed House Sales increases slightly in April
• Lawler: REO inventory of "the F's" and PLS
• Fannie Mae reports $2.7 billion in income, REO inventory declines in Q1 2012
• The economic impact of stabilizing house prices?
• The Declining Participation Rate
• Housing: Inventory declines 21% year-over-year in early May

Nenhum comentário:
Postar um comentário