| Will The Three Trends of 2009 Prevail in 2010? | 
 |
|
 | GaveKal Five Corners
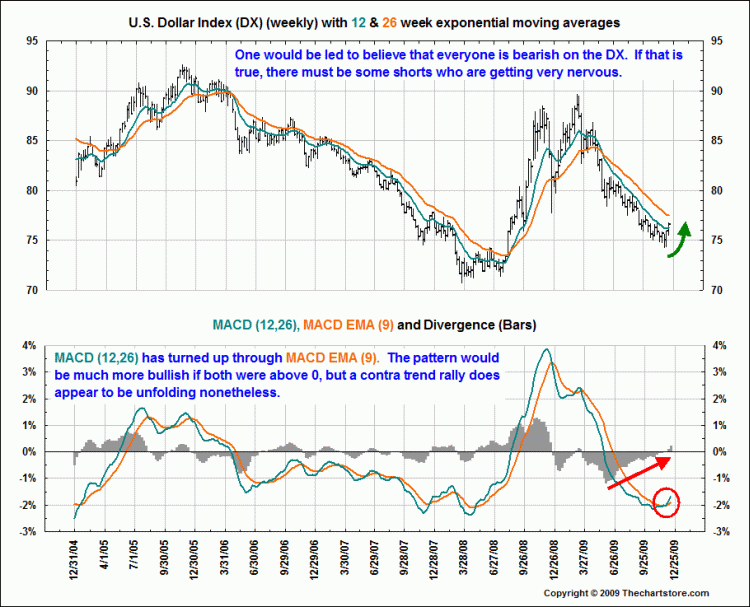
Looking back at the past year, we can conclude that three inter-related trends have dominated financial markets: 1) an impressive weakness in the US$, 2) a significant rally in commodities, and 3) a pronounced out-performance of emerging markets, including Asia.Today, these three trends appear to be running out of steam: the US$ has been rallying, commodities have rolled over and, in November, for the first time in what feels like an eternity, the US MSCI actually out-performed all other countries in the World MSCI index. For us, this begs the question of whether the trends of 2010 will prove different to those of 2009? And the answer to that question may be found in the most unlikely of places, namely the Middle-East.
The news that a Dubai World unit would be suspending payments to creditors, was promptly followed by the rumor that two defaulted Saudi groups (the Saad group and the Ahab group) were treating their domestic creditors differently than foreign banks. From our standpoint in Hong Kong, all these bleak headlines lead us to ponder how the Middle East could find itself in this tight spot? After all, who, a decade ago, would have bet on Dubai (soon to be followed by Venezuela?) going bust with oil at US$80/bbl?
Of course, the apparent squeeze may be nothing more than a few bad apples that blatantly mismanaged their liabilities and blew up their balance sheets. But we have to admit that we are also intrigued by the recent announcements that some of the region's sovereign wealth funds (Qatar, Kuwait...) have lately been selling the large stakes they acquired in Western financials at the beginning of last year's financial crisis. Of course, these disposals may be the result of a deep relief that the banks are back above their purchase price and, like a money manager who has just been on a gut-wrenching ride, the SWF are happy to turn the page and put this episode behind them. Or perhaps, the sales are an indication that the Middle East needs US$ right now and that we are now confronting some kind of squeeze on the US$.
Thus, the recent strength in the US$ may be highlighting that we are experiencing an important change in the investment environment. Indeed, at the risk of making a mountain out of sand-dune, we believe that one thing is for sure: recent developments in Saudi and Dubai will most likely give pause to foreign banks looking to expand their lending operations in that region. And if financing for projects becomes more challenging, then this raises the question of whether the Middle East will look to pump more oil in a bid to generate the revenue necessary to keep the wheels churning? Could an unfolding financial squeeze in the Middle-East lead to the kind of massive cheating on OPEC quotas that we witnessed in the 1980s?
Of course, a proper financial squeeze in the Middle-East, one that triggered a US$ rally and lower oil prices, would de facto justify the Fed's decision to keep interest rates low for a long time. With lower oil would come lower inflation expectations, while a higher US$ would help keep the US economy from overheating under the twin stimulus of lower oil and low interest rates. But where would all this leave other emerging markets, most specifically Asian equities which have soared in the past year?
Historically, Asian equities tend to struggle when the Dollar rallies as a strong US$ forces Asian central banks, who typically run pegs or managed floats, to print less aggressively. But at the same time, most Asian economies would likely welcome the extra liquidity that lower oil prices would provide, not to say anything about an environment of continued low interest rates. More importantly, a possible environment of higher US$/weaker commodities would likely lead to a massive rotation within the markets away from commodity producers and property developers (the key beneficiaries of an ever falling US$ and big components of Chinese indices), and towards manufacturers and exporters (whose margins have been caught between the rock of weak US demand and the hard place of rising materials costs). In other words, a reversal in the weak US$/strong commodity trend would likely trigger a rotation away from 'price monetizers' towards 'volume monetizers'.
Ricardo, Schumpeter or Malthus?by Charles Gave
We are today very fortunate in having a very broad, highly diversified client base with readers in over 40 countries and in all sorts of businesses, from property developers to mining companies, and of course hedge funds, mutual fund companies and pension funds. We are not bringing this up to brag but because, over the years, we have noticed that, regardless of their locations and underlying businesses, investors tend to fall into one of three categories:
- Disciples of Ricardo: The law of comparative advantage, as first described by Ricardo, guarantees an optimal distribution of labor and capital between countries, and thus a very good growth rate for profits. This is true as long as comparative advantages have not been fully exploited. And, of course, the one part of the world where Ricardo's law of comparative advantages is just beginning to have an impact is, of course, emerging markets (for example, see The Bullish Growth in China's Road Infrastructure). Thus, 'Ricardian investors' tend to be very biased today towards emerging markets.
- Disciples of Schumpeter: For Schumpeterians, the source of high returns can be found in the influence of the entrepreneur/inventor and breakthroughs in technology. Such investors tend to favor knowledge-based companies (we have called these platform-companies), and usually carry overweight position in tech stocks, healthcare stocks and other growth stocks.
- Disciples of Malthus: For such investors, commodities cannot not be in short supply over time given the growth of the world's population and of overall global incomes. Commodity prices will thus have to rise given that we are confronting a world with too many Chinese/Indians/Asians... and not enough oil/copper/gold/iron-ore etc... For Malthusians, the solution is thus simple: load up on commodities or commodities producers or load up on gold and stay outright bearish of most asset classes. Most of the perma-bears (as opposed to cyclical bears) we have met over the years tend to be disciples of Malthus.
In our opinion, to reach a diversified position, one can build a portfolio on Ricardo and Malthus, on the assumption that rising living standards in emerging markets will lead to a structural rise in prices of many commodities. And while history does not support such a view, it still makes plenty of logical sense.
Alternatively, to capture the returns available in the 'volume' growth part of the capitalistic system, rather than the 'price' part, one can build a portfolio focused on Ricardo (emerging markets) and Schumpeter (tech and platform companies). This happens to be the portfolio we have been recommending for some time (thereby highlighting our own biases).
But building a portfolio based on Schumpeter and Malthus makes no sense. Schumpeter and Malthus are mutually exclusive (which may explain why our very Schumpeterian book, Our Brave New World, was so poorly received by the various Malthusians we know?). Indeed, Schumpeterians will tend to believe that 'necessity is the mother of all inventions' and have unlimited faith in the human spirit. Malthusians, meanwhile, will take a much darker view of things.
Take today as an example: inventors across the globe are feverishly trying to discover ways to break the stranglehold on growth created by commodity shortages, especially on the energy front (from more efficient cars, to new forms of energy generation, etc...). If they succeed, the Malthusian values will quickly disappear. If they do not, then one should become very bearish about long-term global growth prospects. After all, we would essentially enter into a very dangerous world where the producers of commodities would likely be instructed by political powers to keep materials for the local population. The world would rapidly become quite inhospitable...
The interesting point is that this year, these three sources of value (emerging markets, technology, materials...) have all risen at the same time, and by more or less the same amount. This cannot last. At some point, one or two of the forces will have to pull away and one will be left trailing behind. On our side, we continue to believe that the long-term bet favors Ricardo & Schumpeter over Malthus.
China's Two Turning Pointsby Arthur Kroeber
Over the course of the past year, we have witnessed:
- The first global economic rebound which was not led by the US. Instead, the 2009 economic rebound finds its root in China.
- For the first time in China's 30-year reform era, export value fell for the year.
- In spite of collapsing exports, China will most likely be the only G20 country to grow faster in 2009 than it did in 2008.
So how did China do it? And how sustainable is this miraculous Chinese economic expansion? As almost everyone knows, Beijing has plugged the growth gap triggered by falling exports through a massive ramp-up in public infrastructure spending. And of course, rapid investments in public works have come with their fair share of friction risk, most notably corruption which in turn have led to a rapid rise in the fringe assets used to hide shady money (high-end HK real estate? Chinese art? Gold? Macau gambling...) and to a growing clamor that China is rapidly becoming a massive bubble.
Having addressed these fears in numerous papers (see How China Got Here & Where is China Heading?), we would like to focus instead on the fact that exports will never again be the driver of growth that it has been over the past two decades. From 1989 to 2008, exports grew at an annual average of +19%. This growth was divided into two distinct phases: 1) up through 2001--a dividing line that coincides with both China's entry into the WTO and the start of the American housing bubble--Chinese exports grew at +15% a year, and were highly cyclical; 2) in 2002-08, they grew at an astonishing +27% a year, with no cyclical dips. This year, exports are estimated to fall (for the first time in China's three-decade reform history) by around -15%. Even after the global economy recovers, it is unlikely that exports can sustainably exceed +8-10% growth per annum, given the very high base, and the weakness of the rich economies. In short, future export growth will be less than half the average of the last 20 years, and less than a third of the past seven years.
Aside from the roll-over in exports, China's second important turning point is a bit further off, but is no less crucial. For the entire three decades of China's reform era, the dependency ratio--the ratio of people of non-working age to those of working age--has been falling, from a high of around 80 dependents per 100 workers in the mid-1970s, to under 40 today.
As in the other high-growth Asian economies before, a falling dependency ratio resulted in a higher saving rate, which enabled large investments, and an abundant labor force, which kept wages low. By 2015 at the latest, this ratio will start to rise because of the aging population, and the "demographic dividend" will turn into a demographic tax. The saving rate will begin to come down, the labor market will get tighter, and real wages will start to rise more sharply. A tighter labor market and upward wage pressures were already in evidence by 2007, and will re-appear quite soon once the impact of last year's financial crisis fades.
These two turning points in the export sector and demographics mean that China's traditional growth model--which relied on favorable demographics, rapidly expanding exports, and capital deepening--is nearing its use-by date. Future growth will be slower, and its nature needs to change in order for the economy to avoid running aground altogether. Real annual GDP growth averaged nearly +10% over the past thirty years. For the next decade or so an annual growth rate of +8% is sustainable, and at some point in the 2020s--when China's economy will be about three-quarters the size of the US economy--the growth rate will slow further, to +5% or so. But what will all this mean for financial markets and investors into China's high growth economy? For the answer to this question, see the next section.
Why Invest in China Now?by Louis-Vincent Gave
In spite of a record pace of economic growth, the returns of Chinese equities for buy and hold shareholders have, thus far, been fairly paltry. For example, since the launch of the H-share market in 1994, investors in the HK listed Chinese companies have massively underperformed owners of Italian government bonds (who would like to take the bet that over the next 15 years, Italian bonds once again return almost 80% more than Chinese equities? Very few investors would knowingly take that bet though interestingly, a number of large pension funds, insurance companies and other long-term investors today own more PIGS gov't bonds than Chinese equities!).

In the past, China has gotten a lot of efficiency and productivity improvements courtesy of its booming export sector. But now, as export growth slows, more homegrown efficiency and productivity improvements are required. In the broadest terms, this requires three main policy directions:
- The efficiency of capital, which is quite low, must be dramatically improved through a comprehensive reform of the financial system and the development of robust capital markets. Very encouragingly, this is happening. Hardly a week goes by without the announcement of some financial reform, whether it be attempts at creating a domestic corporate bond market, creation of consumer finance companies, emergence of SME lending desks at banks, launch of the Chi-Next market in Shenzhen, etc (see What Will 2009 Be Remembered For? and It's Different this Time).
- Second, fragmented and distorted domestic markets must be knitted together and deregulated, in order to give private entrepreneurs scope for productive investments other than steel mills and upscale housing developments. To some degree, this is also happening and, as deregulation unfolds, it offers up tremendous opportunities for long-term investors.
- Finally, the country's parlous fiscal system must be overhauled so that governments at all levels focus less on big capital-spending projects and more on the provision of public goods. In our view, this is the greatest challenge that Chinese policymakers face today.
In short, the immediate rebalancing requirement for China is not so much to reduce the rate of investment, but instead to increase the efficiency of investment. If this is achieved, then substantial increases in household incomes, domestic consumption, and returns on invested capital for investors will follow. The bull market which now seems to have started would then be very long lasting, and churn out an ever increasing number of opportunities. It is our belief that China's economic transition will generate exciting investment opportunities, and hopefully, attractive returns for investors. At the very least--better returns than PIGS debt!
Categorizing Europe's Weakest Sovereignsby Gavin Bowring
The recent scares in Dubai have re-ignited fears of sovereign defaults and the spotlight has once again been cast on Europe's problem countries. These can be split into two categories: (1) those within the core EU; and (2) those from CEE and fringe countries, the latter being much less economically developed, and often fraught with troubled domestic politics. Here are some factors worth considering for the two groups in determining the degree of bearishness one should have on individual creditworthiness:
(1) The CEE & Fringe Countries: The ECB this week warned that Baltic states risk being "sucked into a second debt-fuelled economic crisis" if their governments fail to impose adequate austerity measures (see Bloomberg). This may simply be posturing by the ECB (Latvian and Lithuanian foreign reserve levels recently hit record highs, possibly as a result of external aid--see Light in the Latvian Tunnel?), however the Baltics' insistence on maintaining Euro pegs means they remain a high risk. Going forward, in many other CEE countries, political risk will play a huge factor in determining the efficiencies of budget allocation. Already there are concerns--in Romania, heightened political risk over recent disputed election results could further delay commitments to budget reform (the IMF has suspended a US$30bn loan to Romania, in turn putting further pressure on the budget and current account deficits). In Hungary, investors are worried that elections next year could spell victory for an opposition which has forecast a 2010 budget deficit of twice the target approved by lawmakers...
(2) Euro-Area Countries As is well known, the biggest problem economies in the Euro-area are Ireland, Spain and Greece, all of which are mired in debt and economic malaise. The Irish economy, with a debt-to-GDP ratio forecast to rise from the current 66% to 96% by 2011, is obviously in miserable shape, but at least the government appears willing to take painful and politically risky measures--massive wage cuts and income reductions are being implemented across the spectrum, in tandem with proposed tax increases on income and levies on public sector pensions (see details of tough 2010 budget here). In Spain and Greece, by contrast, the governments still appear resistant to hard choices that might help them tackle their debt, which in Greece's case is forecast to rise from the current 112% to 130% of GDP by 2011. Within weeks of winning the country's elections in October, the Greek socialist government raised the budget deficit forecast to 12.7%, twice the previous government's forecast. Spain's debt to GDP ratio at 55% is below the European average, but it is suffering the ongoing effects of a major housing bubble implosion. Yet unit labor costs in Spain rose +0.4%YoY in the third quarter despite an 18% unemployment rate. More worrying are the fears that European banks in general and Spanish banks in particular have been slow to write off bad assets (how could Spanish banks have managed to largely avoid Spain's massive housing bust?).
With these concerns coming to the fore, we believe the European Divergence Trade is back on. We also expect such concerns to provide another reason to sell the Euro vs the US$, though the coming decline of the Euro from the current very overvalued levels will not provide countries like Ireland and Greece much relief in the near future. After all, in terms of their real effective exchange rates, these two countries, along with Spain, have appreciated the most in the past decade.
|
|
|
|