sábado, 26 de dezembro de 2009

No Agenda - NA-159-2009-12-24


#159 No Agenda For Thursday December 24th 2009
Health Care Doublecross

Discover Simple, Private Sharing at Drop.io


Direct Link to the show.
Comment

terça-feira, 22 de dezembro de 2009

Teapots from Space: Attack of the Space Junk


The first episode of 'Teapots from Space'. How much space junk is there and how did it get into space? Watch the space teapots and teapot-abducted astronomers talk about space junk and space telescopes.

domingo, 20 de dezembro de 2009

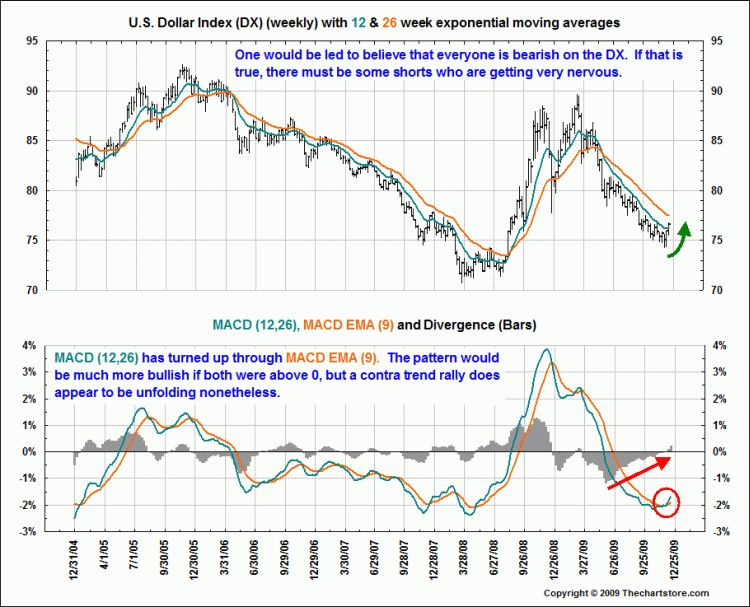
Dollar Rally !


Dollar Rally !

We know that “Short the US Dollar” has been a crowded trade for soem time now. And, after falling 41% from 2001 to 2008, the fat part of the collapse has already happened.
Will it continue? That’s what today’s chart looks at.
How likely is it that the rest of the world will stand idly by and allow:  a) US manufacturing competitiveness a huge advantage via weak currency?;  2) Massive US debt to be inflated away through dollar weakness?
Quite possibly not, as other currencies engage in a race to the bottom. The chart below suggests a dollar rally is in the offing:
>

US Dollar Index Weekly with MACD

12-11-09 Weekly DX w-MACD
Courtesy of Ron Griess of The Chart Store

sábado, 19 de dezembro de 2009

Climate change...


Thanks to Luekella,

The cartoon is by Joel Pett and appeared in USA today. Source:http://www.cartoons.nytimages.com/portal/wieck_preview_page_208831

As maiores aquisições no mundo tecnológico em 2009.


http://googlediscovery.com/2009/12/18/as-maiores-aquisicoes-no-mundo-tecnologico-em-2009/?utm_source=feedburner&utm_medium=feed&utm_campaign=Feed:+googlediscovery+(Google+Discovery.com)&utm_content=Google+Reader

O TechCrunch reuniu as maiores aquisições de empresas no mundo tecnológico em 2009. Somando aproximadamente US$ 54 bilhões, a lista das 30 maiores aquisições envolve, somente, empresas ligadas à área de tecnologia, como web, software, hardware e celular.
Entre as grandes aquisições, a que mais se destacou foi a compra, por US$ 7,4 bilhões, da Sun Microsystems pela Oracle, que ainda aguarda aprovação da Comissão Europeia. Também merece destaque a aquisição da 3Com pela Hewlett-Packard por US$ 2,7 bilhões e a compra realizada pela Intel da Wind River, que atua na área de Otimização de Software de Dispositivos (Device Software Optimization ou DSO), por US$ 884 milhões.
Já entre as aquisições que mais causaram impacto no mercado, destaca-se a compra, por US$ 1,2 bilhão, da empresa especializada em sapatos Zappos pela Amazon, maior varejista online do mundo. Ainda houve a compra, por US$ 750 milhões, da AdMob, especialiada no mercado de publicidade móvel, pelo Google.
A lista abaixo ainda pode sofrer alteração pois algumas transações, como a compra do Yelp, maior site de resenhas para negócios, pelo Google ainda não foi confirmada. Se concluída, a transação pode chegar a US$ 500 milhões.

---

sexta-feira, 18 de dezembro de 2009

Will The Three Trends of 2009 Prevail in 2010?


Will The Three Trends of 2009 Prevail in 2010?
GaveKal Five Corners
Looking back at the past year, we can conclude that three inter-related trends have dominated financial markets: 1) an impressive weakness in the US$, 2) a significant rally in commodities, and 3) a pronounced out-performance of emerging markets, including Asia.Today, these three trends appear to be running out of steam: the US$ has been rallying, commodities have rolled over and, in November, for the first time in what feels like an eternity, the US MSCI actually out-performed all other countries in the World MSCI index. For us, this begs the question of whether the trends of 2010 will prove different to those of 2009? And the answer to that question may be found in the most unlikely of places, namely the Middle-East.
The news that a Dubai World unit would be suspending payments to creditors, was promptly followed by the rumor that two defaulted Saudi groups (the Saad group and the Ahab group) were treating their domestic creditors differently than foreign banks. From our standpoint in Hong Kong, all these bleak headlines lead us to ponder how the Middle East could find itself in this tight spot? After all, who, a decade ago, would have bet on Dubai (soon to be followed by Venezuela?) going bust with oil at US$80/bbl?
Of course, the apparent squeeze may be nothing more than a few bad apples that blatantly mismanaged their liabilities and blew up their balance sheets. But we have to admit that we are also intrigued by the recent announcements that some of the region's sovereign wealth funds (Qatar, Kuwait...) have lately been selling the large stakes they acquired in Western financials at the beginning of last year's financial crisis. Of course, these disposals may be the result of a deep relief that the banks are back above their purchase price and, like a money manager who has just been on a gut-wrenching ride, the SWF are happy to turn the page and put this episode behind them. Or perhaps, the sales are an indication that the Middle East needs US$ right now and that we are now confronting some kind of squeeze on the US$.
Thus, the recent strength in the US$ may be highlighting that we are experiencing an important change in the investment environment. Indeed, at the risk of making a mountain out of sand-dune, we believe that one thing is for sure: recent developments in Saudi and Dubai will most likely give pause to foreign banks looking to expand their lending operations in that region. And if financing for projects becomes more challenging, then this raises the question of whether the Middle East will look to pump more oil in a bid to generate the revenue necessary to keep the wheels churning? Could an unfolding financial squeeze in the Middle-East lead to the kind of massive cheating on OPEC quotas that we witnessed in the 1980s?
Of course, a proper financial squeeze in the Middle-East, one that triggered a US$ rally and lower oil prices, would de facto justify the Fed's decision to keep interest rates low for a long time. With lower oil would come lower inflation expectations, while a higher US$ would help keep the US economy from overheating under the twin stimulus of lower oil and low interest rates. But where would all this leave other emerging markets, most specifically Asian equities which have soared in the past year?
Historically, Asian equities tend to struggle when the Dollar rallies as a strong US$ forces Asian central banks, who typically run pegs or managed floats, to print less aggressively. But at the same time, most Asian economies would likely welcome the extra liquidity that lower oil prices would provide, not to say anything about an environment of continued low interest rates. More importantly, a possible environment of higher US$/weaker commodities would likely lead to a massive rotation within the markets away from commodity producers and property developers (the key beneficiaries of an ever falling US$ and big components of Chinese indices), and towards manufacturers and exporters (whose margins have been caught between the rock of weak US demand and the hard place of rising materials costs). In other words, a reversal in the weak US$/strong commodity trend would likely trigger a rotation away from 'price monetizers' towards 'volume monetizers'.

Ricardo, Schumpeter or Malthus?

by Charles Gave
We are today very fortunate in having a very broad, highly diversified client base with readers in over 40 countries and in all sorts of businesses, from property developers to mining companies, and of course hedge funds, mutual fund companies and pension funds. We are not bringing this up to brag but because, over the years, we have noticed that, regardless of their locations and underlying businesses, investors tend to fall into one of three categories:
  • Disciples of Ricardo: The law of comparative advantage, as first described by Ricardo, guarantees an optimal distribution of labor and capital between countries, and thus a very good growth rate for profits. This is true as long as comparative advantages have not been fully exploited. And, of course, the one part of the world where Ricardo's law of comparative advantages is just beginning to have an impact is, of course, emerging markets (for example, see The Bullish Growth in China's Road Infrastructure). Thus, 'Ricardian investors' tend to be very biased today towards emerging markets.

  • Disciples of Schumpeter: For Schumpeterians, the source of high returns can be found in the influence of the entrepreneur/inventor and breakthroughs in technology. Such investors tend to favor knowledge-based companies (we have called these platform-companies), and usually carry overweight position in tech stocks, healthcare stocks and other growth stocks.

  • Disciples of Malthus: For such investors, commodities cannot not be in short supply over time given the growth of the world's population and of overall global incomes. Commodity prices will thus have to rise given that we are confronting a world with too many Chinese/Indians/Asians... and not enough oil/copper/gold/iron-ore etc... For Malthusians, the solution is thus simple: load up on commodities or commodities producers or load up on gold and stay outright bearish of most asset classes. Most of the perma-bears (as opposed to cyclical bears) we have met over the years tend to be disciples of Malthus.
In our opinion, to reach a diversified position, one can build a portfolio on Ricardo and Malthus, on the assumption that rising living standards in emerging markets will lead to a structural rise in prices of many commodities. And while history does not support such a view, it still makes plenty of logical sense.
Alternatively, to capture the returns available in the 'volume' growth part of the capitalistic system, rather than the 'price' part, one can build a portfolio focused on Ricardo (emerging markets) and Schumpeter (tech and platform companies). This happens to be the portfolio we have been recommending for some time (thereby highlighting our own biases).
But building a portfolio based on Schumpeter and Malthus makes no sense. Schumpeter and Malthus are mutually exclusive (which may explain why our very Schumpeterian book, Our Brave New World, was so poorly received by the various Malthusians we know?). Indeed, Schumpeterians will tend to believe that 'necessity is the mother of all inventions' and have unlimited faith in the human spirit. Malthusians, meanwhile, will take a much darker view of things.
Take today as an example: inventors across the globe are feverishly trying to discover ways to break the stranglehold on growth created by commodity shortages, especially on the energy front (from more efficient cars, to new forms of energy generation, etc...). If they succeed, the Malthusian values will quickly disappear. If they do not, then one should become very bearish about long-term global growth prospects. After all, we would essentially enter into a very dangerous world where the producers of commodities would likely be instructed by political powers to keep materials for the local population. The world would rapidly become quite inhospitable...
The interesting point is that this year, these three sources of value (emerging markets, technology, materials...) have all risen at the same time, and by more or less the same amount. This cannot last. At some point, one or two of the forces will have to pull away and one will be left trailing behind. On our side, we continue to believe that the long-term bet favors Ricardo & Schumpeter over Malthus.

China's Two Turning Points

by Arthur Kroeber
Over the course of the past year, we have witnessed:
  • The first global economic rebound which was not led by the US. Instead, the 2009 economic rebound finds its root in China.
  • For the first time in China's 30-year reform era, export value fell for the year.
  • In spite of collapsing exports, China will most likely be the only G20 country to grow faster in 2009 than it did in 2008.
So how did China do it? And how sustainable is this miraculous Chinese economic expansion? As almost everyone knows, Beijing has plugged the growth gap triggered by falling exports through a massive ramp-up in public infrastructure spending. And of course, rapid investments in public works have come with their fair share of friction risk, most notably corruption which in turn have led to a rapid rise in the fringe assets used to hide shady money (high-end HK real estate? Chinese art? Gold? Macau gambling...) and to a growing clamor that China is rapidly becoming a massive bubble.
Having addressed these fears in numerous papers (see How China Got Here & Where is China Heading?), we would like to focus instead on the fact that exports will never again be the driver of growth that it has been over the past two decades. From 1989 to 2008, exports grew at an annual average of +19%. This growth was divided into two distinct phases: 1) up through 2001--a dividing line that coincides with both China's entry into the WTO and the start of the American housing bubble--Chinese exports grew at +15% a year, and were highly cyclical; 2) in 2002-08, they grew at an astonishing +27% a year, with no cyclical dips. This year, exports are estimated to fall (for the first time in China's three-decade reform history) by around -15%. Even after the global economy recovers, it is unlikely that exports can sustainably exceed +8-10% growth per annum, given the very high base, and the weakness of the rich economies. In short, future export growth will be less than half the average of the last 20 years, and less than a third of the past seven years.
Aside from the roll-over in exports, China's second important turning point is a bit further off, but is no less crucial. For the entire three decades of China's reform era, the dependency ratio--the ratio of people of non-working age to those of working age--has been falling, from a high of around 80 dependents per 100 workers in the mid-1970s, to under 40 today.
As in the other high-growth Asian economies before, a falling dependency ratio resulted in a higher saving rate, which enabled large investments, and an abundant labor force, which kept wages low. By 2015 at the latest, this ratio will start to rise because of the aging population, and the "demographic dividend" will turn into a demographic tax. The saving rate will begin to come down, the labor market will get tighter, and real wages will start to rise more sharply. A tighter labor market and upward wage pressures were already in evidence by 2007, and will re-appear quite soon once the impact of last year's financial crisis fades.
These two turning points in the export sector and demographics mean that China's traditional growth model--which relied on favorable demographics, rapidly expanding exports, and capital deepening--is nearing its use-by date. Future growth will be slower, and its nature needs to change in order for the economy to avoid running aground altogether. Real annual GDP growth averaged nearly +10% over the past thirty years. For the next decade or so an annual growth rate of +8% is sustainable, and at some point in the 2020s--when China's economy will be about three-quarters the size of the US economy--the growth rate will slow further, to +5% or so. But what will all this mean for financial markets and investors into China's high growth economy? For the answer to this question, see the next section.

Why Invest in China Now?

by Louis-Vincent Gave
In spite of a record pace of economic growth, the returns of Chinese equities for buy and hold shareholders have, thus far, been fairly paltry. For example, since the launch of the H-share market in 1994, investors in the HK listed Chinese companies have massively underperformed owners of Italian government bonds (who would like to take the bet that over the next 15 years, Italian bonds once again return almost 80% more than Chinese equities? Very few investors would knowingly take that bet though interestingly, a number of large pension funds, insurance companies and other long-term investors today own more PIGS gov't bonds than Chinese equities!).
jmotb121409image001
There are, or course, a multitude of reasons behind the inability of Chinese equity markets to monetize the impressive growth of the domestic economy. But chief amongst them must be the capital intensive nature of China's growth thus far. But now, given the challenges presented by the demographic shift and the slowdown in exports, China has no choice but to make the transition from an economy driven by growth in factor inputs (capital and labor) to one driven by efficiency and productivity improvement.
In the past, China has gotten a lot of efficiency and productivity improvements courtesy of its booming export sector. But now, as export growth slows, more homegrown efficiency and productivity improvements are required. In the broadest terms, this requires three main policy directions:
  1. The efficiency of capital, which is quite low, must be dramatically improved through a comprehensive reform of the financial system and the development of robust capital markets. Very encouragingly, this is happening. Hardly a week goes by without the announcement of some financial reform, whether it be attempts at creating a domestic corporate bond market, creation of consumer finance companies, emergence of SME lending desks at banks, launch of the Chi-Next market in Shenzhen, etc (see What Will 2009 Be Remembered For? and It's Different this Time).

  2. Second, fragmented and distorted domestic markets must be knitted together and deregulated, in order to give private entrepreneurs scope for productive investments other than steel mills and upscale housing developments. To some degree, this is also happening and, as deregulation unfolds, it offers up tremendous opportunities for long-term investors.

  3. Finally, the country's parlous fiscal system must be overhauled so that governments at all levels focus less on big capital-spending projects and more on the provision of public goods. In our view, this is the greatest challenge that Chinese policymakers face today.
In short, the immediate rebalancing requirement for China is not so much to reduce the rate of investment, but instead to increase the efficiency of investment. If this is achieved, then substantial increases in household incomes, domestic consumption, and returns on invested capital for investors will follow. The bull market which now seems to have started would then be very long lasting, and churn out an ever increasing number of opportunities. It is our belief that China's economic transition will generate exciting investment opportunities, and hopefully, attractive returns for investors. At the very least--better returns than PIGS debt!

Categorizing Europe's Weakest Sovereigns

by Gavin Bowring
The recent scares in Dubai have re-ignited fears of sovereign defaults and the spotlight has once again been cast on Europe's problem countries. These can be split into two categories: (1) those within the core EU; and (2) those from CEE and fringe countries, the latter being much less economically developed, and often fraught with troubled domestic politics. Here are some factors worth considering for the two groups in determining the degree of bearishness one should have on individual creditworthiness:
(1) The CEE & Fringe Countries: The ECB this week warned that Baltic states risk being "sucked into a second debt-fuelled economic crisis" if their governments fail to impose adequate austerity measures (see Bloomberg). This may simply be posturing by the ECB (Latvian and Lithuanian foreign reserve levels recently hit record highs, possibly as a result of external aid--see Light in the Latvian Tunnel?), however the Baltics' insistence on maintaining Euro pegs means they remain a high risk. Going forward, in many other CEE countries, political risk will play a huge factor in determining the efficiencies of budget allocation. Already there are concerns--in Romania, heightened political risk over recent disputed election results could further delay commitments to budget reform (the IMF has suspended a US$30bn loan to Romania, in turn putting further pressure on the budget and current account deficits). In Hungary, investors are worried that elections next year could spell victory for an opposition which has forecast a 2010 budget deficit of twice the target approved by lawmakers...
(2) Euro-Area Countries As is well known, the biggest problem economies in the Euro-area are Ireland, Spain and Greece, all of which are mired in debt and economic malaise. The Irish economy, with a debt-to-GDP ratio forecast to rise from the current 66% to 96% by 2011, is obviously in miserable shape, but at least the government appears willing to take painful and politically risky measures--massive wage cuts and income reductions are being implemented across the spectrum, in tandem with proposed tax increases on income and levies on public sector pensions (see details of tough 2010 budget here). In Spain and Greece, by contrast, the governments still appear resistant to hard choices that might help them tackle their debt, which in Greece's case is forecast to rise from the current 112% to 130% of GDP by 2011. Within weeks of winning the country's elections in October, the Greek socialist government raised the budget deficit forecast to 12.7%, twice the previous government's forecast. Spain's debt to GDP ratio at 55% is below the European average, but it is suffering the ongoing effects of a major housing bubble implosion. Yet unit labor costs in Spain rose +0.4%YoY in the third quarter despite an 18% unemployment rate. More worrying are the fears that European banks in general and Spanish banks in particular have been slow to write off bad assets (how could Spanish banks have managed to largely avoid Spain's massive housing bust?).
With these concerns coming to the fore, we believe the European Divergence Trade is back on. We also expect such concerns to provide another reason to sell the Euro vs the US$, though the coming decline of the Euro from the current very overvalued levels will not provide countries like Ireland and Greece much relief in the near future. After all, in terms of their real effective exchange rates, these two countries, along with Spain, have appreciated the most in the past decade.
jmotb121409image002


image
John F. Mauldin
johnmauldin@investorsinsight.com
image

The Weekly Report For December 14th - December 18th, 2009


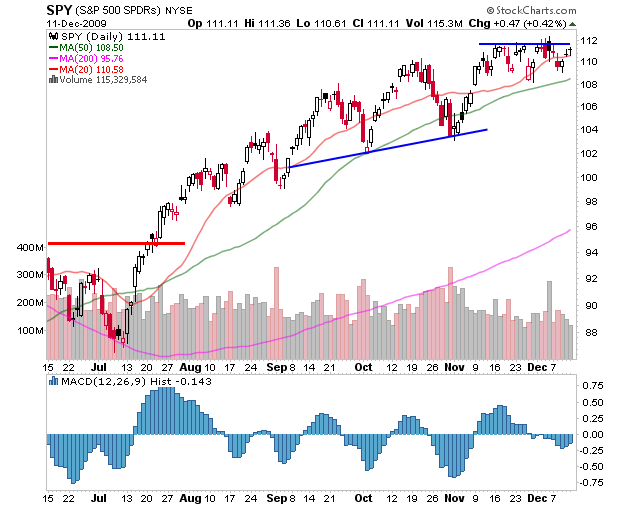
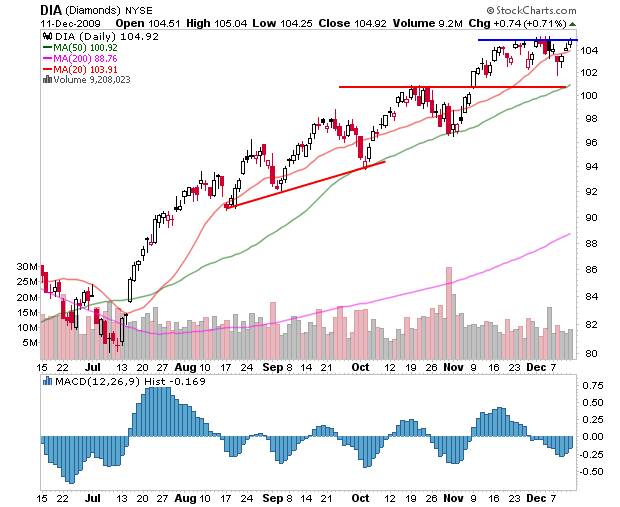
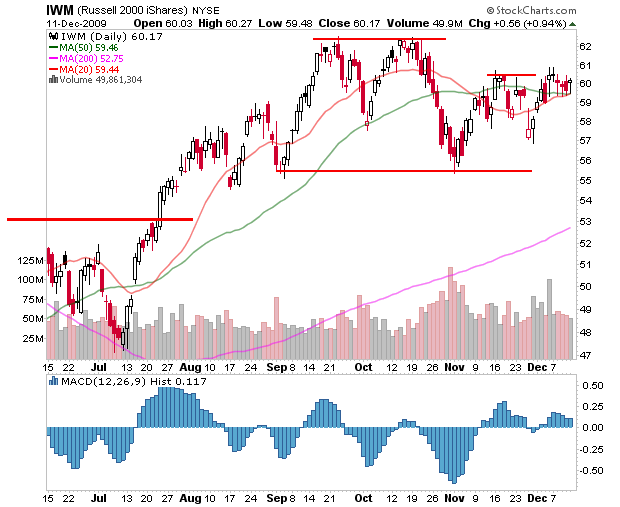
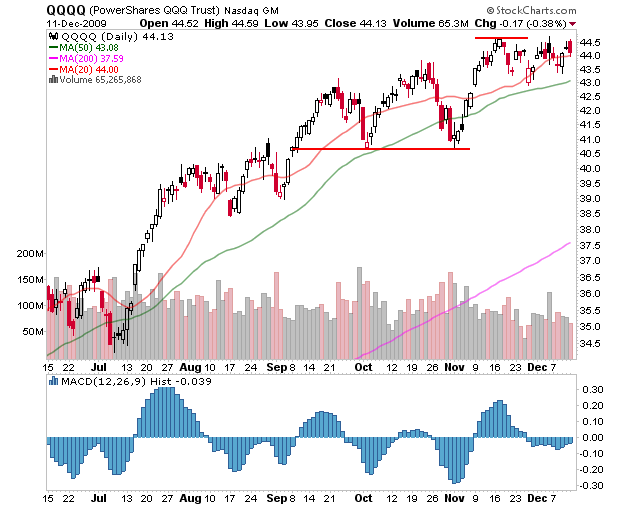
Commentary: As last week was filled with a few wild swings, the markets decided to take a break and go nowhere this week. Three out of the five days were met with a stand still between the bulls and bears, and the other two days basically canceled each other out. In the end, the major indexes finished the week almost exactly where they began. The indexes are still precariously perched just beneath their recent highs while building steam for a larger move. The key question is: to what side will the break move?

The S&P500, as represented by the S&P 500 SPDRS (NYSE:SPY) ETF, has continued to consolidate the late October run up and has refused to give up much ground. While the recent attempts to clear resistance have failed, the fact that SPY is not retracing deeper is bullish. This sideways range has been expected, with the emotional low put into place in late November, and the stiff resistance overhead. Both of these levels continue to be the lines in the sand for both bulls and bears to watch.


The Diamonds Trust, Series 1 (NYSE:DIA) ETF is in much the same position as SPY except it did manage to gain on the week. In fact, it closed very near its recovery highs and could attempt a breakout next week. With the transports performing well this week, a move higher by DIA could have these two averages moving higher in unison, which is bullish according to the Dow theory. (For a refresher on this subject, check out Intro To Dow Theory.)


The small caps, as represented the iShares Russell 2000 Index (NYSE:IWM) ETF, are starting to consolidate in a tight range, possibly leading up to a strong move to either direction. One interesting clue provided by IWM this week was the ability to close all five days above its 20- and 50-day moving averages. This is a decent show of strength, especially after spending several weeks below these averages. The recent highs are key, as a move above them could trigger some short covering and possibly buyers in a seasonally positive period for this group.


The Powershares QQQ ETF (Nasdaq:QQQQ also finished the week near unchanged, although the Friday session was marked with a failure near the recent highs. Apple, Inc.(Nasdaq:AAPL) has been under selling pressure for the past couple of weeks, and weighing down on this average. QQQQ remains in a consolidation much like the other market ETFs, also holding above its 20- and 50-day moving averages. These averages would be the first level to watch, with the recent highs and lows as the areas to watch for confirmation of a larger move.

 
Bottom Line
This was a challenging week for shorter-term traders as there were several days with very little movement. The market is digesting the recent move, and should make a move to one direction soon. With options expiration approaching next week, it's possible the next large move will take place as soon as the next few days. As traders, sometimes the best move we can make is to sit on our hands and wait for a clearer signal to emerge. This could very well be one of those times, as there are conflicting signals just as the market is getting ready for a large move. The key levels to watch are clearly defined, and remain where traders should be focusing most of their attention. Use the Investopedia Stock Simulator to trade the stocks mentioned in this stock analysis, risk free!

terça-feira, 8 de dezembro de 2009

Coming Collapse of Municipal Bonds; States, Cities Dig Deeper Holes


Coming Collapse of Municipal Bonds; States, Cities Dig Deeper Holes

In New Jersey, governor-elect Christie opposes (and rightfully so), the state going deeper in debt but that is not stopping the current administration of Jon Corzine.

Please consider N.J. to Borrow $200 Million Amid Incoming Governor’s Opposition.
New Jersey, the third-most indebted U.S. state, will sell more than $200 million in bonds today to finance voter-approved capital projects a week after Governor- elect Christopher Christie said he opposed borrowing more money.

The state will issue $209.1 million of bonds, including $205 million of tax-exempt securities, the largest such competitively bid offering in the market today, according to Bloomberg data. Christie, a Republican who defeated Democratic incumbent Jon Corzine last month, said he opposed new bond sales after the state last week detailed $2.7 billion in borrowing it plans for the remainder of the fiscal year, which ends in June.

The state’s bond sale today will finance clean water and open-space preservation projects, according to a preliminary official statement. The state is also planning to sell $1.4 billion of bonds for transportation and $1.1 billion for school construction before June 30, according to a Nov. 30 report.

Christie, 47, a former U.S. attorney, told Bloomberg News last week that New Jersey “can’t have any more debt” and that any projections for borrowing will be “rendered meaningless” when he takes office on Jan. 19.

New Jersey has $36.5 billion of gross tax-supported debt, the third highest of the 50 states, according to a report released in July by Moody’s Investors Service. Moody’s rates the state’s bonds Aa3, the fourth highest ranking. California has the most, at $75.2 billion.

New York City is leading the municipal market this week as issuers seek to borrow more than $10 billion, according to Bloomberg data. New York, the largest borrower among U.S. cities, is selling $1.4 billion of taxable and tax-exempt securities, including $616 million of Build America Bonds. By yesterday, the city had taken orders from individual investors for $440 million of the tax-exempt bonds, and for $20 million in Build America Bonds that it expects to finish pricing on Dec. 10, according to Ray Orlando, a spokesman for the city Office of Management and Budget.

Yields on conventional 20-year municipal debt fell to an eight-week low of 4.24 percent, down 1.34 percentage points from a year ago, according to a weekly Bond Buyer index.
New Jersey Perspective

New Jersey has $36.5 billion of gross tax-supported debt.
California has $75.2 billion of gross tax-supported debt.
New Jersey has a population of 8,682,661.
California has a population of 36,756,666.

Let's do the math.
New Jersey has 23.6% of the population of California and 48.5% of the tax supported debt.

Municipal Bond Bubble

It is not just New Jersey going nuts, California clearly did as well, and cities like New York are in deep trouble.

The city of Vallejo, California fired a huge warning shot by declaring bankruptcy. However, that warning shot has largely been ignored.

Given there is no realistic way for this debt to be paid back, municipal bonds are in a bubble.

People are chasing municipals because of tax exempt status but they are not compensated for for the risk. Please consider the following table courtesy of Investing Bonds


Assuming a 28% tax bracket, the effective yield on a 4% yield muni is 5.56. 20 year treasuries are yielding about 4%. A lousy 1.5% is all you get for the additional risk that a municipal bond blows up. I hardly see how it can possibly be worth it.

Although there is no provision for states to declare bankruptcy (there should be), cities, municipalities, and counties can.

I expect several counties in Florida to default. Major cities like Houston are a distinct possibility as well. Please see City of Houston is Bankrupt (So are California, Oregon, and Pension Plans in General) for details.

When counties and counties start declaring bankruptcy, municipal bond yields are going to soar across the board.

If there is little to no compensation for this risk (and there isn't), then why take it? As with the "free lunch" of Asset Backed Commercial Paper, investors are going to learn the hard way once again.

Mike "Mish" Shedlock
http://globaleconomicanalysis.blogspot.com
Click Here To Scroll Thru My Recent Post List
Mike "Mish" Shedlock is a registered investment advisor representative for SitkaPacific Capital Management. Sitka Pacific is an asset management firm whose goal is strong performance and low volatility, regardless of market direction. Visit http://www.sitkapacific.com/account_management.html to learn more about wealth management and capital preservation strategies of Sitka Pacific.

Morgan Stanley: Fed to Raise Rates in 2nd Half of 2010


Morgan Stanley: Fed to Raise Rates in 2nd Half of 2010

In a research note titled: "The Fed Will Exit in 2010", Morgan Stanley's Richard Berner and David Greenlaw forecast that the Fed will raise the Fed Funds rate in the 2nd half of 2010 to 1.5%.

They are forecasting GDP to increase 2.8% in both 2010 and 2011, and for unemployment to peak in Q1 2010 at 10.3%, and decline to 9.5% in 2011.

The GDP and unemployment rate forecasts are consistent with each other (see my post:Employment and Real GDP), but the real question is why do they expect the Fed to raise rates in the 2nd half of 2010 with a sluggish recovery?

The reason is they expect inflation expectations to pickup, and the Fed to react by raising rates (to 1.5% by the end of 2010, and 2.0% by the end of 2011). That would be unusually since the Fed historically waits until sometime well after the unemployment rate peaks.

The following graph is from I post I wrote in September: Fed Funds and Unemployment Rate

Fed Funds and UnemploymentClick on graph for larger image in new window.

This graph shows the effective Fed Funds rate (Source: Federal Reserve) and the unemployment rate (source: BLS)

In the early '90s, the Fed waited more than a 1 1/2 years after the unemployment rate peaked before raising rates. The unemployment rate had fallen from 7.8% to 6.6% before the Fed raised rates.

Following the peak unemployment rate in 2003 of 6.3%, the Fed waited a year to raise rates. The unemployment rate had fallen to 5.6% in June 2004 before the Fed raised rates.

Here is more from Paul Krugman: When should the Fed raise rates? (even more wonkish)

Goldman Sachs recently forecast that the Fed will be on hold through 2011:
The key features of our 2011 outlook: (1) a strengthening in growth from 2.1% on average in 2010 to 2.4% in 2011, with real GDP rising at an above-potential 3½% pace in late 2011; (2) a peaking in unemployment in mid-2011 at about 10¾%; (3) extremely low inflation – close to zero on a core basis during 2011; and (4) a continuation of the Fed’s (near) zero interest rate policy (ZIRP) throughout 2011.
Although there are other considerations - such as inflation expectations, I don't expect the Fed to raise rates until late in 2010 at the earliest - and more likely sometime in 2011 or even later.

A crônica de uma alta anunciada


A crônica de uma alta anunciada

A equipe econômica do presidente Lula está convencida de que há um movimento no mercado visando forçar um aumento de juros na segunda reunião do Copom (Comitê de Política Monetária) em 2010. Reunião programada para março do próximo ano. Poderia ser a última com o presidente do Banco Central, Henrique Meirelles, no cargo, caso ele decida mesmo sair candidato para disputar algum posto na eleição. Na avaliação da equipe de Lula, seria uma forma de tentar antecipar uma alta dos juros que todos consideram inevitável, mas que teria de vir apenas no segundo semestre de 2010. Qual a lógica dessa pressão do mercado? Facilitar a vida e reduzir pressões sobre aquele que viria a substituir Meirelles no comando do BC. O nome mais cotado hoje é o de Alexandre Tombini, um funcionário de carreira respeitado e que conta com a simpatia do Palácio do Planalto. Mas que não teria a mesma autonomia do atual presidente do banco. Ou seja, Meirelles teria muito mais poder e liberdade para iniciar esse movimento de alta dos juros antes de sua saída do cargo, pavimentando o caminho para os necessários ajustes na política monetária diante da forte retomada do crescimento da economia no início do próximo ano. A vida de seu substituto ficaria muito mais fácil. Bastaria a ele dar continuidade a um processo leve e gradual de alta dos juros, visando manter na meta não a inflação de 2010, mas a de 2011, no primeiro ano do sucessor do presidente Lula. Leia mais (08/12/2009 - 20h51)

segunda-feira, 30 de novembro de 2009

The Weekly Report For November 30th - December 4th, 2009


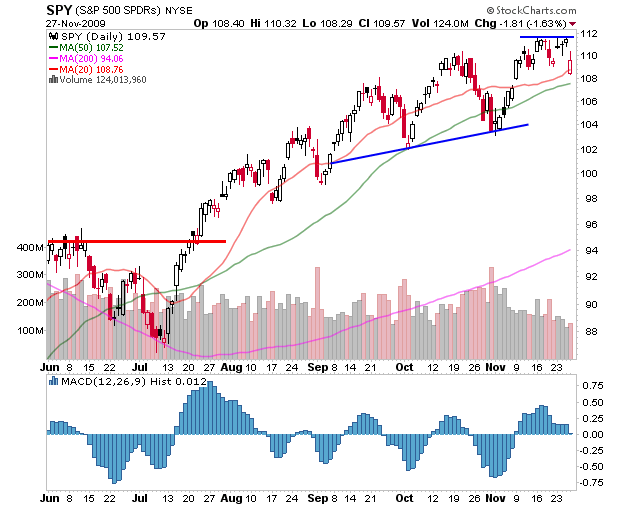
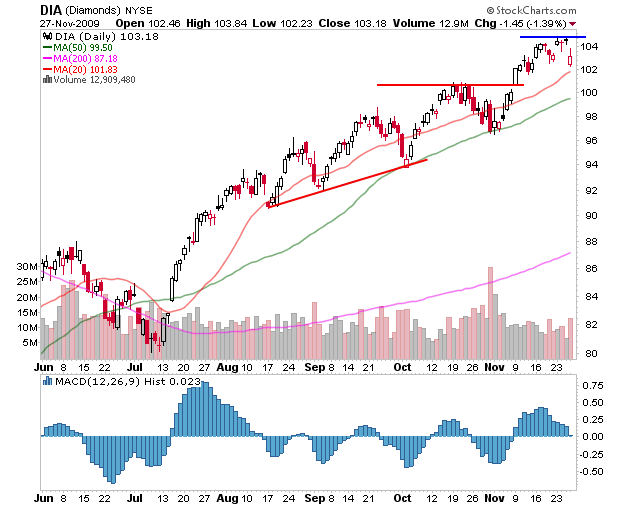
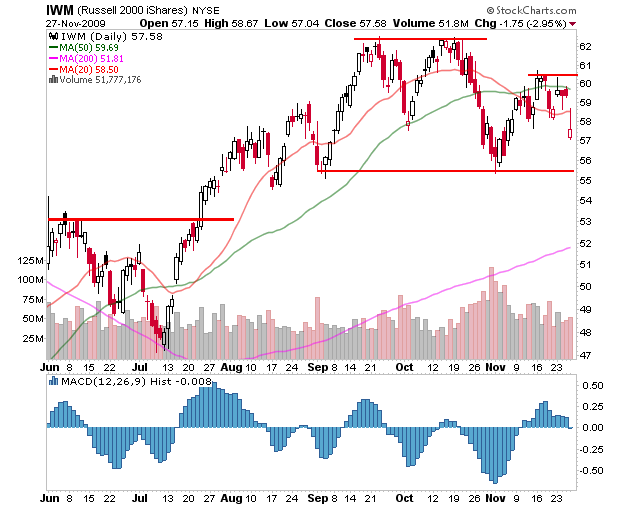
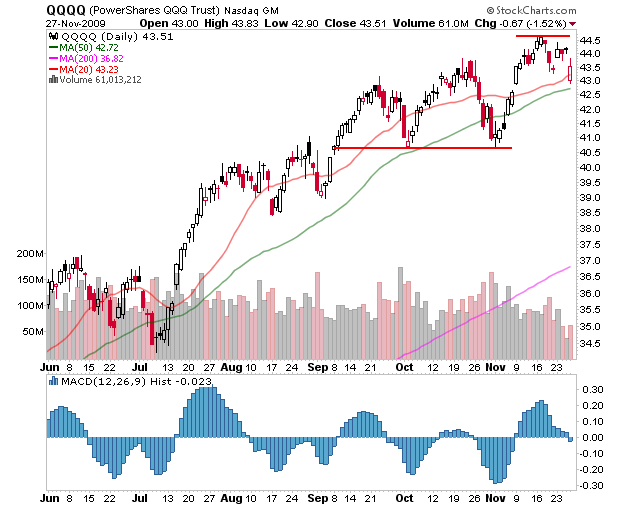
Commentary: What began as a typical low-volume, dull holiday week on Wall Street ended with quite a show as the markets gapped down near 3% on Black Friday. The weakness was attributed to the news that Dubai was attempting to delay repayment on much of its $60 billion in debt. There was some very interesting action as most of the markets gapped under the trading range from the past two weeks, but quickly found buyers willing to step in. The end result was a close well off the lows, but still down over 1% across the board.
The chart for the S&P 500, as represented by the S&P 500 SPDRS (NYSE:SPY) ETF, shows the gap down into the 20-day moving average with strong buying after the weak open. SPY was able to pare its the losses, although it didn't manage to fill the gap. There are now two very important levels in the daily chart. With the gap down, the recent highs are now a strong resistance level, and the lows that were defended on the gap down are also very important psychological barriers for the bulls.

Source: StockCharts

The Diamonds Trust Series 1 (NYSE:DIA) ETF has continued to hold above its November breakout and remains in a better position compared to other market ETFs. The Dow is the least representative of the general markets as it only tracks 30 companies, but they are some of the largest companies by market cap and are followed by many traders. The recent highs are an important level to watch, and while the gap down low is important, the November breakout is the level that should be watched in the case of further downside. (For further reading, check out The Anatomy Of Trading Breakouts.)


Source: StockCharts

The iShares Russell 2000 Index (NYSE:IWM) ETF continues to look very unhealthy. Despite the strength it showed in rebounding from the gap down on Black Friday, IWM remains under its 20- and 50-day moving averages. It is also well below a lower high set in early November, which could act as strong resistance on a move to test the range. The lows near $56 are critical for IWM, as a break below would cement a topping pattern and project to a move near the $50-$51 area.


Source: StockCharts

The Powershares QQQ ETF (Nasdaq:QQQQ) also defended the gap down on Black Friday and ended near its November breakout area. It ended down on the day, but well off its lows. Much like the other market ETFs, the recent highs now take on more importance with the gap down from those levels. The gap down left many traders banking on a continuation move underwater and many will be looking to get out on a move back to these levels.


Source: StockCharts

Bottom Line
There is a real mix of strength and weakness in all of these charts. If you look closely, all of these charts save for IWM have an upside gap in November that remains unfilled, despite today's gap lower. This is a show of strength, as bulls defended this area rather well. However, the gap lower wasn't filled on the upside either, and all the indexes closed off their highs as well. The markets remain in a veritable "no man's land", as the risk-reward to either side is not attractive for opening new positions. Next week should resolve some questions as traders return from the holiday week and the important levels highlighted above are tested. 

Reckless Myopia


John P. Hussman, Ph.D.
I was wrong.
Not about the implosion of the credit markets, which I urgently warned about in 2007 and early 2008. Not about the recession, which we shifted to anticipating in November 2007. Not about the plunge in the stock market, which erased the entire 2002-2007 market gain, which was no surprise. Not about the "ebb and flow" of short-term data, which I frequently noted could produce a powerful (though perhaps abruptly terminated) market advance even in the face of dangerous longer-term cross-currents. I expect not even about the "surprising" second wave of credit distress that we can expect as we move into 2010.
From a long-term perspective, my record is very comfortable. But clearly, I was wrong about theextent to which Wall Street would respond to the ebb-and-flow in the economic data – particularly the obvious and temporary lull in the mortgage reset schedule between March and November 2009 – and drive stocks to the point where they are not only overvalued again, but strikingly dependent on a sustained economic recovery and the achievement and maintenance of record profit margins in the years ahead.
I should have assumed that Wall Street's tendency toward reckless myopia – ingrained over the past decade – would return at the first sign of even temporary stability. The eagerness of investors to chase prevailing trends, and their unwillingness to concern themselves with predictable longer-term risks, drove a successive series of speculative advances and crashes during the past decade – the dot-com bubble, the tech bubble, the mortgage bubble, the private-equity bubble, and the commodities bubble. And here we are again.
We face two possible states of the world. One is a world in which our economic problems are largely solved, profits are on the mend, and things will soon be back to normal, except for a lot of unemployed people whose fate is, let's face it, of no concern to Wall Street. The other is a world that has enjoyed a brief intermission prior to a terrific second act in which an even larger share of credit losses will be taken, and in which the range of policy choices will be more restricted because we've already issued more government liabilities than a banana republic, and will steeply debase our currency if we do it again. It is not at all clear that the recent data have removed any uncertainty as to which world we are in.
Taking the weighted average outcome for the two states of the world still produces a poor average return/risk tradeoff. Taking the weighted average investment position for the two states of the world is somewhat more constructive. As I noted several weeks ago, I have adapted our weightings accordingly. As a result, we have been trading around a modest positive net exposure, increasing it slightly on market weakness, and clipping it on strength, as is our discipline. Currently, the Strategic Growth Fund has a net exposure to market fluctuations of less than 10%, but enough "curvature" (through index options) that our exposure to market risk will automatically become more muted on market weakness and more positive on market advances, allowing us to buy weakness and sell strength without material concern about the (increasing) risk of a market collapse.
There is no chance, even in hindsight ("could have, would have, should have" stuff) that I would have responded to the existing evidence in recent months with more than a moderate exposure to market risk during some portion of the advance since March. But our year-to-date returns might now be into a second digit had I recognized that investors have learned utterly nothing from the bubbles and collapses of the past decade. That recognition might have encouraged a greater weight on trend-following measures versus fundamentals, valuations, price-volume sponsorship, and other factors.
Still, our stock selections continue to perform well relative to the market, our risks remain well-managed through a substantial (though not full) hedge, and our investment approach has nicely outperformed the S&P 500 over complete market cycles, with substantially less downside risk than a passive investment approach. We have implemented some modest changes to improve our potential to benefit from (even ill-advised) speculative runs, but we've done fine nonetheless, and we can sleep nights.
Whether or not I have focused too much on probable "second-wave" credit risks is something we will find out in the quarters ahead – my record of economic analysis is strong enough that a "miss" on that front would be an outlier. What I do think is that over the past decade, investors (including people who hold themselves out as investment professionals) have become far more susceptible to reckless myopia than I would have liked to believe. They have become speculators up to the point of disaster.
Frankly, I've come to believe that the markets are no longer reliable or sound discounting mechanisms. The repeated cycle of bubbles and predictable crashes over the recent decade makes that clear. Rather, investors appear to respond to emerging risks no more than about three months ahead of time. Worse, far too many analysts and strategists appear to discount the future only in the most pedestrian way, by taking year-ahead earnings estimates at face value, and mindlessly applying some arbitrary and historically inconsistent multiple to them.
This is utterly different from true discounting – which does not rely on multiples, but instead carefully traces out the likely path of future revenues, profit margins, cash flows and earnings over time, and explicitly discounts expected payouts and probable terminal values back at an appropriate rate of return. That's what we actually do here. Talking in terms of multiples can make the process easier to explain, and can be a reasonable approach to the market as a whole if earnings are normalized properly, but ultimately, an investment security is a claim to a long-term stream of cash flows. It is not simply a blind multiple to the latest analyst estimate.
Fortunately, the evidence suggests that the long-term returns to a careful discounting approach tend to be strong even if investors repeatedly behave in speculative and short-sighted ways. This is because long-term returns are fully determined by the stream of cash flows actually received by investors over time, and because inappropriate valuations ultimately tend to mean-revert. In the face of speculative noise, the long-term returns from a proper discounting approach may not capture as much speculative return as might be possible, but over time, many of those speculative swings tend to wash out anyway.
In part, the market's increasing propensity toward speculation reflects the increasing lack of fiscal and monetary discipline from our leaders. Policy makers who seek quick fixes and could care less about long-term consequences undoubtedly encourage investors to embrace the same value system. Paul Volcker was the last Fed Chairman to have any sense that discipline and the acceptance of temporary discomfort was good for the nation.
Our current Fed Chairman's voice literally quivers in response to the phrase "bank failure," even though in the present context, a bank failure implies none of the disorganized outcomes that characterized the Great Depression. It simply means that the bondholders take a loss and the remaining part of the institution survives intact as a "whole bank" entity (and can be sold or re-issued back to public ownership, less the debt to bondholders, as such). The same outcome would have been possible with Lehman had the FDIC been granted authority from Congress to take conservatorship of a non-bank financial entity.
In my estimation, there is still close to an 80% probability (Bayes' Rule) that a second market plunge and economic downturn will unfold during the coming year. This is not certainty, but the evidence that we've observed in the equity market, labor market, and credit markets to-date is simply much more consistent with the recent advance being a component of a more drawn-out and painful deleveraging cycle. Meanwhile, valuations are clearly unfavorable here, and even under the "typical post-war recovery" scenario, we are observing an increasing number of internal divergences and non-confirmations in market action.
As Gluskin Sheff chief economist David Rosenberg noted last week, "Even if the recession is over, the historical record shows that downturns induced by asset deflation and credit contraction are different than a garden-variety recession induced by Fed tightening and excessive manufacturing inventories since the former typically induce a secular shift in behavior and attitudes towards debt, asset allocation, savings, discretionary spending and homeownership. The latter fades more quickly.
"This is why people didn't figure out that it was the Great Depression until two years after the worst point in the crisis in the 1930s; and why it took decades, not months, quarters or even years, for the complete transition to the next sustainable economic expansion and bull market.
"Mortgage applications for new home purchases hit a 12-year low in the middle of November (down 22% in the past month!), fully two weeks after the Administration said it was going to not only extend but expand the program to include higher-income trade-up buyers. Once again, there is minimal demand for autos and housing, and that is partly because the market is still saturated with both of these credit-sensitive big-ticket items after an unprecedented credit and consumer bubble that went absolutely parabolic in the seven years prior to the collapse in the financial markets an asset values. We are probably not even one-third of the way through this deleveraging cycle. Tread carefully."
Andrew Smithers, one of the few other analysts who foresaw the credit implosion and remains a credible voice now, concurred last week in an interview with my friend Kate Welling (a former Barrons' editor now at Weeden & Company): "The good news so far is that the stock market got down to pretty much fair value or even, possibly, a tickle below it, at its March bottom. But now it has gone up… we probably have a market which is, roughly, 40% overpriced.  In order to assess value, it is necessary either to calculate the level at which the EPS would be if profits were neither depressed nor elevated, or to use a metric of value which does not depend on profits. The cyclically adjusted P/E (CAPE) normalizes EPS by averaging them over 10 years. It thus follows the first of those two possible methods. Using even longer time periods has advantages, particularly as EPS have been exceptionally volatile in recent years - and using longer time periods raises the current measured degree of overvaluation. The other methodology we use measures stock market value without reference to profits: the q ratio. It compares the market capitalization of companies with their net worth, also adjusted to current prices. The validity of both of these approaches can be tested and is robust under testing - and they produce results that agree. Currently, both q and CAPE are saying that the U.S. stock market is about 40% overvalued."
In the chart below, the current data point would be about 0.4, not as extreme as we observed in 1929, 2000, or 2007 of course, but equal to or beyond what we've observed at virtually every other market peak in history. This aligns well with our own analysis, where as I've noted in recent weeks, the S&P 500 is priced to deliver one of the weakest 10-year total returns in history except for the (ultimately disappointing) period since the mid-1990's.
jmotb113009image001
One of the fascinating aspects of the past few months is the lack of equilibrium thinking with respect to what happened to the trillions of dollars in government money that has been spent to defend the bondholders of mismanaged financial companies. Almost by definition, money given to corporations will show up most quickly as improvements in corporate earnings, and then slightly later, as executive compensation. A few pieces came across my desk last week, hailing the ability of the corporate sector to bounce back from the recent economic downturn even though revenues have continued to suffer and employment has been steeply cut. Why is this a surprise? Where else could the money have gone? Labor compensation? It is truly mind-numbing that a moment after a temporary surge oftrillions of dollars, borrowed and tossed out of a helicopter (though to specific corporations and private beneficiaries), analysts would hail a subsequent improvement in corporate results as evidence of "resilience."
What matters is sustainability, and unfortunately, it is clear that credit continues to collapse. Banks are contracting their loan portfolios at a record rate, according to the latest FDIC Quarterly Banking Profile. Even so, new delinquencies continue to accelerate faster than loan loss reserves. Tier 1 capital looked quite good last quarter, as one would expect from the combination of a large new issuance of bank securities, combined with an easing of accounting rules to allow "substantial discretion" with respect to credit losses. The list of problem institutions is still rising exponentially. Overall, earnings and capital ratios have enjoyed a reprieve in the past couple of quarters, but delinquencies have not, and all evidence points to an acceleration as we move into 2010.

Urgent Policy Implications

From a policy standpoint, it is effectively too late to forestall further foreclosures absent explicit losses to creditors. The best policy option now is to make sure that the second wave does not result in a debasement of the U.S. dollar. The way to do that is to require three things:
First, the FDIC should be given regulatory authority to take non-bank financials into conservatorship the way they should have been able to do with Bear Stearns and Lehman. If this authority had existed in 2008, Bear's bondholders would not now stand to get 100% of their money back, with interest, as they presently do, and Lehman's disorganized liquidation would have been completely unnecessary. As I've noted before, the problem with Lehman was not that it went bankrupt, but that it went bankrupt in a disorganized way. If the FDIC had authority over insolvent non-bank financials and bank holding companies, it could wipe out equity and an appropriate amount of bondholder capital, and sell the fully-functioning residual to an acquirer, as is typically done with failing banks, without any loss to depositors or customers.
Second, bank capital requirements should be altered to require a substantial portion of bank debt to be of a form that automatically converts to equity in the event of capital inadequacy. This would force losses onto bondholders, rather than onto taxpayers. This policy adjustment is urgent – we have perhaps a few months to get this right.
Finally, Congress should be clear that government funds will be available only to protect the interests of depositors, not bondholders. Specifically, any funds provided by the government should be contingent on the ability to exert a senior claim to bondholders in the event of subsequent bankruptcy, even if a category is created to allow those funds to be counted as "capital" for purposes of satisfying capital requirements prior to such bankruptcy. Government-provided capital should be subordinate only to depositor claims, if equity and bondholder capital ultimately proves insufficient to meet those obligations.
Since early 2008, beginning with the provision of non-recourse funding in the Bear Stearns debacle, the Federal Reserve and the Treasury have repeatedly allocated or implicitly obligated public funds to defend the bondholders of mismanaged financial companies. This has included the outright and non-recourse purchase of nearly a trillion dollars in mortgage securities that have no explicit guarantee by the U.S. government. By purchasing these securities outright (rather than through a well-defined repurchase agreement), the Fed is effectively obligating the U.S. government to either guarantee them or to absorb any future losses.
Aside from the fraction of bailout funding that was specifically allocated by Congress through legislation, these actions represent an unconstitutional breach into enumerated spending powers that are the domain of the elected members of Congress alone. The issue here is not whether the Fed should be independent from political influence. The issue is the constitutionality of the Fed's actions. The discretion that it has exerted over the past two years crosses the line into prerogatives reserved for Congress. That line needs to be clarified sooner rather than later.
Emphatically, the trillions of dollars spent over the past year were not in the interest of protecting bank depositors or the general public. They went to protect bank bondholders. Instead of taking appropriate losses on those bonds (which financed reckless mortgage lending), those bonds are happily priced near their face value, for the benefit of private individuals, thanks to an equivalent issuance of U.S. Treasury debt. But that's not enough. Outside of a very narrow set of institutions that are subject to compensation limits, just watch how much of the public's money – which benefitted several major investment banks following a very direct route – gets allocated to Wall Street bonuses in the next few weeks.image
John F. Mauldin
johnmauldin@investorsinsight.com
Minha lista de blogs