Commentary: What began as a typical low-volume, dull holiday week on Wall Street ended with quite a show as the markets gapped down near 3% on Black Friday. The weakness was attributed to the news that Dubai was attempting to delay repayment on much of its $60 billion in debt. There was some very interesting action as most of the markets gapped under the trading range from the past two weeks, but quickly found buyers willing to step in. The end result was a close well off the lows, but still down over 1% across the board.
The chart for the S&P 500, as represented by the S&P 500 SPDRS (NYSE:SPY) ETF, shows the gap down into the 20-day moving average with strong buying after the weak open. SPY was able to pare its the losses, although it didn't manage to fill the gap. There are now two very important levels in the daily chart. With the gap down, the recent highs are now a strong resistance level, and the lows that were defended on the gap down are also very important psychological barriers for the bulls.
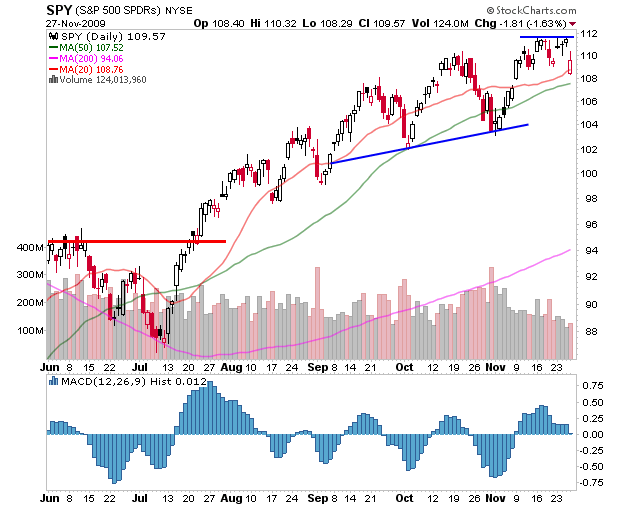 |
| Source: StockCharts |
The Diamonds Trust Series 1 (NYSE:DIA) ETF has continued to hold above its November breakout and remains in a better position compared to other market ETFs. The Dow is the least representative of the general markets as it only tracks 30 companies, but they are some of the largest companies by market cap and are followed by many traders. The recent highs are an important level to watch, and while the gap down low is important, the November breakout is the level that should be watched in the case of further downside. (For further reading, check out The Anatomy Of Trading Breakouts.)
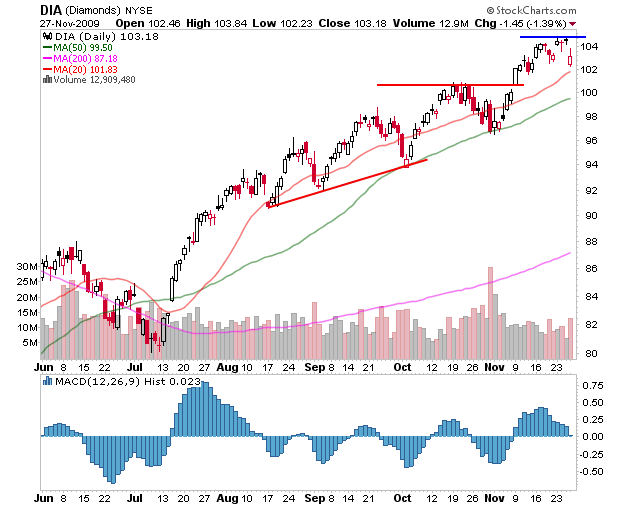 |
| Source: StockCharts |
The iShares Russell 2000 Index (NYSE:IWM) ETF continues to look very unhealthy. Despite the strength it showed in rebounding from the gap down on Black Friday, IWM remains under its 20- and 50-day moving averages. It is also well below a lower high set in early November, which could act as strong resistance on a move to test the range. The lows near $56 are critical for IWM, as a break below would cement a topping pattern and project to a move near the $50-$51 area.
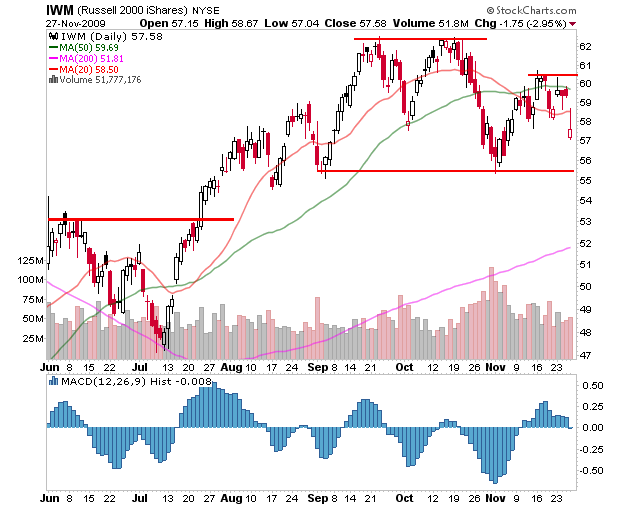 |
| Source: StockCharts |
The Powershares QQQ ETF (Nasdaq:QQQQ) also defended the gap down on Black Friday and ended near its November breakout area. It ended down on the day, but well off its lows. Much like the other market ETFs, the recent highs now take on more importance with the gap down from those levels. The gap down left many traders banking on a continuation move underwater and many will be looking to get out on a move back to these levels.
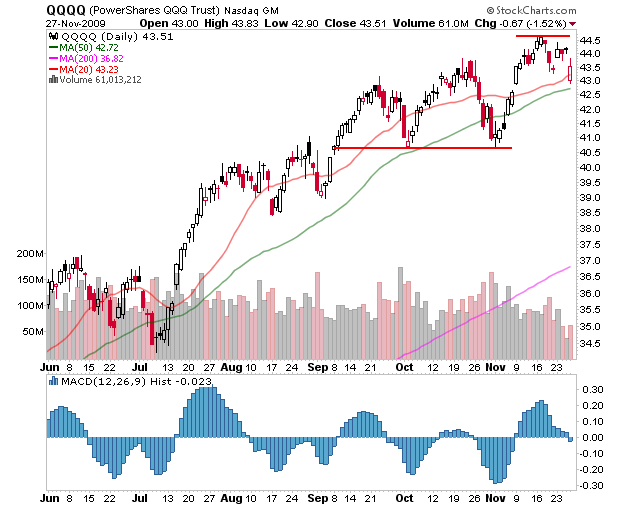 |
| Source: StockCharts |
Bottom Line
There is a real mix of strength and weakness in all of these charts. If you look closely, all of these charts save for IWM have an upside gap in November that remains unfilled, despite today's gap lower. This is a show of strength, as bulls defended this area rather well. However, the gap lower wasn't filled on the upside either, and all the indexes closed off their highs as well. The markets remain in a veritable "no man's land", as the risk-reward to either side is not attractive for opening new positions. Next week should resolve some questions as traders return from the holiday week and the important levels highlighted above are tested.


Nenhum comentário:
Postar um comentário