It looks like the NASDAQ remains in bear market territory while the others major markets are off their lows and down less than 20%, but still painfully down.
Click charts courtesy of Stockcharts.com to view full sized.
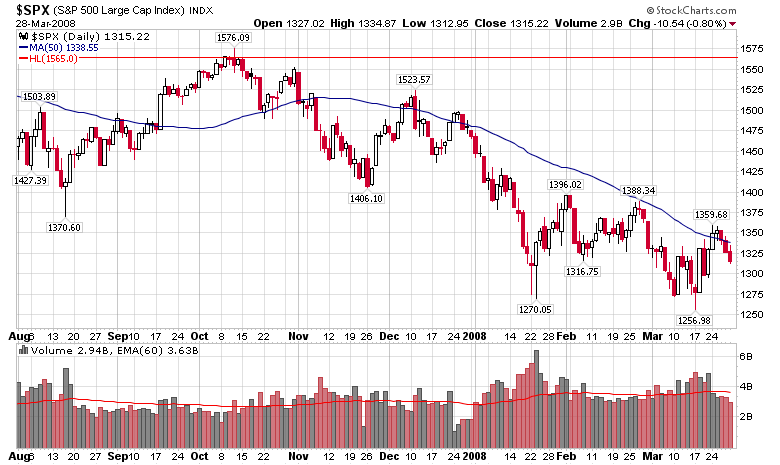
S&P500
More S&P 500 Charts
(Using Intraday prices):
Last Market High 10/11/07 at 1,576.09
Last Market low 03/17/08 at 1,256.98
Current S&P500 Price 1,315.22
Decline in Pts 260.87
Decline in % 16.6%
Max Decline 20.2%
This means the correction from intraday high to intraday low is 20.2% and we are currently 16.6% off the peak.
The decline from the high to the low on a closing basis is 18.6%
DJIA
More DJIA Charts
(Using Intraday prices):
Last Market High 10/11/07 at 14,279.96
Last Market Low 01/22/08 at 11,508.74
Current DJIA Price 12,216.40
Decline in Pts 2063.56
Decline in % 14.5%
Max Decline 19.4%
This means the correction from high to low has been 19.4% and we are currently 14.5% off the peak.
The decline off the high on a closing basis has been 17.1%
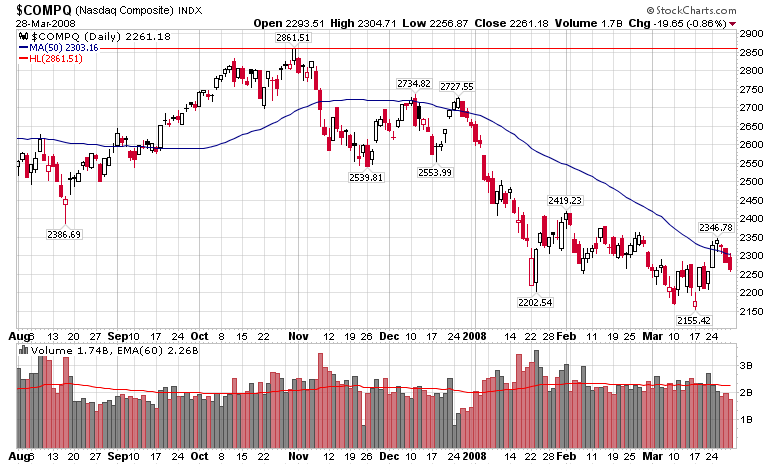
NASDAQ:
More NASDAQ Charts
(Using Intraday prices):
Last Market High 10/31/07 at 2,861.51
Last Market Low 03/17/08 at 2,155.42
Current NASDAQ Price 2,261.18
Decline in Pts 600.33
Decline in % 21.0%
Max Decline 24.7%
This means the correction from high to low has been 24.7% and we are currently 21.0% off the peak.
The decline off the high on a closing basis has been 24.1%
Congratulations to anyone who "market timed" from equities to Gold (GLD on this graph) last October!


Nenhum comentário:
Postar um comentário