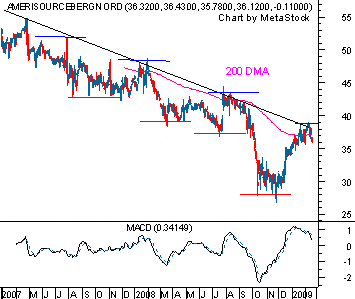
Commentary: In technical analysis, a downtrend is identified by a series of lower highs and lower lows. In today's markets there are endless examples of stocks stuck within a downtrend, but it is not quite as easy to determine the levels that are consistently holding them down. For today's chart, we've chosen to take a look at a two stocks that are trending lower and we'll look at the key areas ofresistance that are preventing a long-term move higher.
On January 28, we took a look at the daily chart of Amerisourcebergen Corp. (NYSE:ABC) because the bulls consistently failed to send the price above a nearby descending trendline since mid-2007. As you can see below, this story has not changed and it is interesting to see how each attempted rally has ended once the price approached the combined resistance of a long-term descending trendline and its 200-day moving average (pink line). We expect that these levels will continue to put downward pressure on the stock. Technical traders will likely keep a bearish outlook on this stock until the price is able to notch a close above the previous high of $38.82. We've also added the MACD indicator to the chart, which recently crossed below its signal line. This type of bearish crossover suggests that the sellers are in control of the direction and that the trend will likely remain downward. We'll keep a close eye on this stock because the bulls have been unable to force a sustained move above the trendline, so the downward MACD crossover will likely minimize the chance of being whipsawed out of a short position. Many traders will likely set their target prices near the November low of $28.  |
We also added the chart of The Advisory Board Co. (Nasdaq:ABCO), which is eerily similar to that of ABC. As you can see, the bulls failed to send the price above the nearby trendline earlier in the month, which suggests that this will continue to be a stronger level of resistance than many traders are hoping for. In this case, it is interesting to note that the 50-day moving average has been preventing any rally from getting started and the majority of bullish traders will likely remain on the sidelines until the price is able to move above this resistance level.
|
Nenhum comentário:
Postar um comentário