US Stocks: A Historical Look at Market-Cap and Style, 1997-2007
Stocks in the US are often classified by market capitalization or by style (growth, value or blend). Those differences are not sufficient to create different asset classes, but within the US stocks asset class they have produced different results.
The categories are similar in character and their correlation with the broad US market is high (from the low 80’s to the high 90’s). For those reasons, they just don’t work well as separate asset classes. That said, they may present some element of opportunity for sub-class rebalancing gains due to return rotation within an allocated portfolio.
The chart shows the return for the index of each category for each of 11 calendar years, including 1997-2007. The top half of the chart color codes each year for each index category based on the level of return. The bottom half of the chart color codes each year according to the rank of the market-cap within the growth, value or blend styles.
Return color coding is as follows:
- Red is for returns < -5%
- Green is for returns > +5%
- Yellow is for returns between -5% and +5%.
Rank color coding is as follows:
- Green for 1st
- Yellow for 2nd
- Red for 3rd.
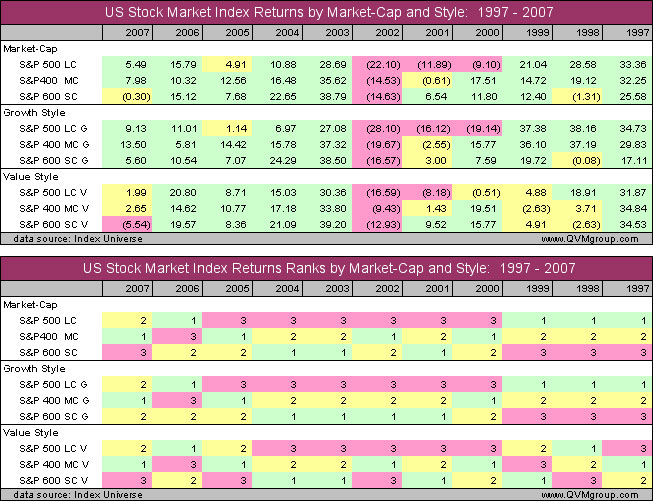
One observation is that the large-cap category had longer periods of negative return than the mid-cap or small-cap categories for all three styles (growth, value and blend). Another observation is that mid-cap seems to have been the highest return category for all three styles.
Looking at annualized returns through April 2008, we see clearly that mid-cap was superior to large-cap over 3, 5 and 10 year holding periods for each of the three styles.
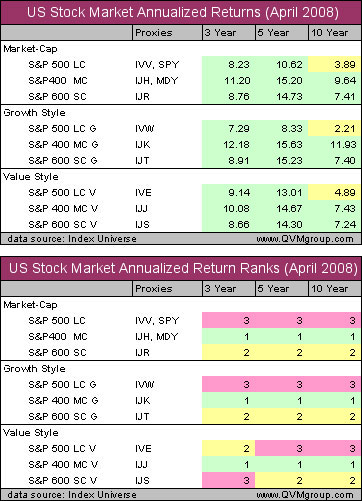
Year-to-date, on May 16, mid-cap is still marginally ahead of the other categories.
In a rear-view mirror approach, these data may suggest an overweighting for mid-cap and small-cap exposure within the US stock asset class, and a compensating underweight of the large-cap category.
The argument may be made that large-cap companies are better able to internally finance growth, may have better global mixes of costs and revenues, and may have more defensible market positions. In the last 10 years that was mostly not sufficient to overcome the other advantages (at least in investor’s eyes) that mid-cap and small-cap companies demonstrated by their returns.
This data does not take into consideration the differences in valuation of the categories then and now. If mid-cap was initially undervalued and if it is currently overvalued, the historic trend would not be expected to continue. Relative valuation at different time periods, however, is a subject for a different article.
A forward look at the categories requires additional information, but history is always good to have in mind at the same time.


Nenhum comentário:
Postar um comentário