In response to the comments to his post, here are a couple of additional graphs:
 Click on graph for larger image.
This graph shows federal, state, and local government employment as a percent of the civilian noninstitutional population since 1976 (all data from the BLS).
Federal government employment has decreased over the last 35 years (mostly in the 1990s), state government employment has been flat, and local government employment has increased.
Note the small spikes very 10 years. That is the impact of the decennial census.
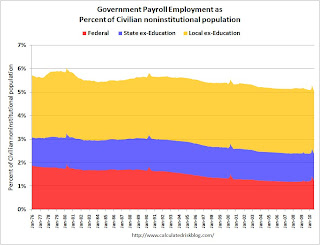 The second graph shows government employment excluding education as a percent of the civilian noninstitutional.
The percent of federal and state government employment (ex-education) have all declined. Local government employment has been steady - so overall government employment (ex-education) as a percent of the civilian population is down over the last 35 years.


Nenhum comentário:
Postar um comentário