http://seekingalpha.com/article/103567-signs-of-a-tradable-bottom-appear
Could we be putting in a tradable bottom here? Or will equities keep going down until the last dog dies?
As I write on Thursday afternoon, the Dow and the S&P are firmly in the green. That doesn't mean a whole lot by itself, of course. These days you never know what the last hour will bring. (On Wednesday the Dow snuck in a 400-point reversal... in the last fifteen minutes of trading!)
Market wackiness aside, though, I think we could be close to a tradable bottom here. That is to say, a time to start scouting for bullish equity plays on the trading side as well as the investing side.
Does that make it "THE" bottom? I'm not interested in that question right now. There's just not enough info to work with yet.
Let's take a look at the facts as they stand, though, to see if you agree with my "tradable bottom" case.
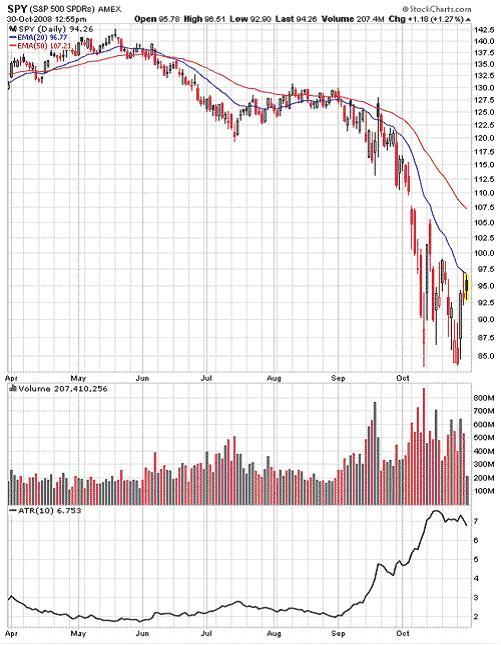
We have a chart of SPY, the S&P 500 ETF (SPY). The Dow Diamonds ETF (DIA) paints a similar picture. I'm just using SPY for a market proxy here.
The first thing to notice is that volume and volatility have both increased these past few weeks – dramatically so – while directionality has decreased. By directionality, I simply mean the amount of "trendiness," or rather, the smoothness and consistency of a directional market move.
Back in June, SPY began its steady slide. It put in a short-term bottom in July, rallied gently into August, and then started sliding anew in September. In the second half of September, all came undone. The relatively tight, smooth, trending patterns of prior months turned into an explosively violent freefall.
You can see how volume (the red and black bars) spiked dramatically in recent months too. Last but not least, the black line below the volume represents "ATR," or average trading range. As the intraday swings grew wider (and wilder), ATR took off.
A Keeper from Soros
What does this little recap have to do with tradable bottoms? It goes back to something I learned from George Soros – maybe the best thing I learned from George Soros.
I know many of you (perhaps most of you) don't like Soros because of his politics. But on the trading and investing side, he is one of the true greats... and the following lesson is one that always stuck with me.
It came in the form of a quick observation from one of Soros' earlier books,The Alchemy of Finance. The book itself is very hard to read -- well nigh unreadable some would say -- but there are some great nuggets in it.
Here is the nugget I think of now (paraphrased): "Volatility is greatest at turning points, diminishing as a new trend becomes established."
Let me state that again because it's so key: Volatility is greatest at turning points, diminishing as a new trend becomes established.
Change Is Unsettling
The old cliché is that bull markets climb a wall of worry, while bear markets slide down a slope of hope. This cliché survives because there's real truth in it. When the market is in the process of adjusting to a known set of factors —a process that takes time as events unfold -- you get a trend.
And so when markets are trending solidly, it's a sign that perceptions are stable and under control... that the "market narrative," be it bullish or bearish, is solid and intact.
At turning points, though, the general consensus evaporates. The prevailing balance of bulls versus bears gets thrown into a cocked hat. Suddenly it's no longer clear whether the trend should cease and desist, throw itself into reverse, or what. Then comes the back and forth – often violent back and forth – as traders and investors scramble for new bearings.
Sometimes a powerful trend will shake off the "correction" and just keep going. Usually when this happens, though, the correction itself is more subdued in volatility terms, like what we saw in July after the Bear Stearns rescue... a relatively modest upmove that didn't get too hairy. The more volatile and high-volume a correction is, especially relative to the preceding trend, the more likely it is to represent something bigger.
Like many market-related things, volatility moves in cycles. It contracts and expands like an accordion. And thus the ebb and flow of volatility is worth paying attention to. Soros is right: While a clear expansion in volatility doesn't always herald the end of a trend, it often does. Soros is also right in that volatility diminishes – that is to say, the trading ranges get smaller and the action gets smoother – as the new trend asserts itself.
Take Another Look
So with that bit of food for thought in mind, take a look at the SPY chart again. We have just been through one of the most violent months in all of market history, and now traders and investors are trying to figure out what's going to happen next.
On the fundamental side, there is widespread consensus that the U.S. has dark times ahead. We are headed into the teeth of a nasty recession – nobody of consequence doubts that now – and the world is in the midst of a painful downturn too.
But what does that mean for Mr. Market ... and what does it mean for cash flows? John Hussman, manager of the Hussman Funds, had this to say to his investors earlier in the week:
Even if we were to completely zero out two solid years of earnings for the S&P 500, the fact is that more than 90% of the value of U.S. stocks would reside in the cash flows beyond that point. The main issue for good, established companies here is not the risk to the long-term stream of cash flows, but to what extent the uncertainty about the coming year or two of earnings will frighten investors to sell at depressed prices (thereby pricing stocks to deliver even higher long-term returns).
The underscore emphasis is mine... something to think about as we ponder what's next. We know that earnings for the next few quarters are going to stink. But Mr. Market knows that too, does he not?
Who's Left to Sell?
Another important question to ask is: Who's left to sell at this point (and how much will they be selling)?
A rising market is fueled by buyers. When you run out of buyers – or rather, when the existing buyers run out of money or enthusiasm – there's not enough force to keep pushing a market higher.
A falling market, conversely, is fueled by sellers. When everyone who can be pushed or panicked out of their position has given up the ghost, there's no more selling pressure to make the market fall.
I don't know how much forced selling there is left in this market, or how many investors who have held on this long are still waiting to panic. But you'd think with what we've gone through (take a glance at that chart again), the weak hands have been pretty well shaken out.
Not the News...
Another oldie but goodie applies here – a trading aphorism you've heard me use before. "It's not the news, it's the reaction to the news."
When the market tanks in the face of good news, that's a sign of weakness. When the market rallies in the face of bad news, that's a sign of strength.
For weeks it felt like the market could do nothing but go down. Every bit of news was met with rampant selling. There was a brief shining ray of hope on news that the governments of the world had come up with a rescue plan... and then it was back to rampant selling.
But on Thursday (the day I write), we saw a shift as eye-catching as bright yellow tulips pushing out of a snowbank. We saw a rally in the face of not-so-great news.
Thursday's GDP report showed the worst quarter in seven years – an economic contraction on par with the quarter after September 11th, 2001. But the market went up instead of down. Nicely up, too. The economic news was horrible, to be sure, but better than the horror many were expecting... and so stocks rose.
A Discounting Mechanism
Remember, too, that stock markets are designed to discount the future, not the past. The value of a company's share price ultimately hinges on its stream of future cash flows. The market looks forward, not backward.
This is part of the reason why stocks rallied on news of the ugliest GDP report in seven years. Expectations were already baked into the cake for ugliness. The market, to some degree, had already discounted the fact that times ahead will be damn tough.
All I know is, when I put my investor hat on, I see some incredibly compelling values out there: stocks trading at valuations that no one expected to see in a million years, for surprising but explainable reasons we've gone over in these pages.
And when I put my trading hat on (a very different hat mind you), I see a market that's gotten the living tar beat out of it -- to the point of wondering how many sellers are left in the building.
I also see a downtrend swallowed up by volatility, areas of the market that practically have Armageddon priced in, and a refreshingly strong reaction to very ugly (just not as ugly as feared) news.
Bears Do It Bigger
Something else to keep in mind: The biggest, strongest rallies don't happen in bull markets. They happen in bear markets. This sounds odd, but like everything else there are reasons for it.
For one thing, bull markets tend to "roll" while bear markets "spike." (Something else you've probably heard me say.)
A nice, friendly bull market is one that moves higher in drifts and spurts month after month, with investors reliably stepping in to "buy the dips" and keep the good times going. Bear markets, on the other hand, are cranky and less predictable. They tend to mix drawn-out, hope-restoring rallies with sharp and nasty drops.
And so a professional short seller is never too comfortable, because he (or she) knows that the next squeeze, or the next extended rally, could be right around the corner.
Another reason bear market rallies tend to impress is because there's so much ground to be made up between the drops. Take Japan's Nikkei index, for example. After falling to 1982 levels (!) on fear that an overstrong Yen would kill Japan's already weak economy, the Nikkei counter-rallied a whopping 26% in the space of three trading days.
Because the previous fall was so vicious, though, that rally still leaves the Nikkei at severely depressed levels. Such is the way of the bear.
Past and Present
There's more to be said here, particularly on the fundamental side of things. We are finally starting to see the credit markets thaw a bit. We are seeing "shock and awe" responses from the central banks of the world the likes of which are never before seen. And for the first time it's not just a handful of governments swinging into action, but cash-flush governments across the globe focused like a laser on avoiding "Great Depression II" at all costs.
That makes a difference. We didn't have that kind of awareness a few months ago, or even a few weeks ago. And there are still the "supernova" policy responses to think of... but we'll save those for another time.
For now I'll leave you with another John Hussman observation:
...Even if this bear market is ultimately headed for a P/E of 7, a single one-way decline, uncorrected by a major rally, is extremely unlikely. [As of Oct 27th], the S&P 500 [had] declined by about 43% on a closing basis. In 1973-74, the market halted its overall decline at about 48%. Likewise in 1929, the market halted its initial decline at 48%, at which point stocks embarked on an advance of nearly 50% over the next 6 months before weakening again. Fear-mongerers like to point to the Great Depression, saying that an investor selling at the low in 1929 would have continued to lose until 1932, but they generally ignore the huge intermittent advances, and the fact that information accumulates slowly. Even in the worst of times, steep market declines tend to produce enormous (if ultimately impermanent) recoveries, as we saw even in the Depression.
I'd love to hear your opinion on this too. Do you agree we could be setting up for a tradable bottom here? Would that be just the thing to confuse all the folks who think this market is going to zero? Or is the idea just too goofy?
Could the Fed's "shock and awe" policies, coordinated with those of Asia/Europe et al, kick off a positive surprise (at least on the paper asset side of things)? Or are you convinced equities will just keep going down and down until the last dog dies?


Nenhum comentário:
Postar um comentário